
MTF Screener MA Cross System
MTF Screener MA Cross System is a multi-timeframe analytical framework that integrates moving average cross logic, higher timeframe context, risk modeling and multi-symbol monitoring within a unified interface.
Overview
Multi-Timeframe Structural Analysis with Integrated Risk and Dashboard Modules
MTF Screener MA Cross System is a multi-timeframe analytical framework that integrates moving average cross logic, higher timeframe context, risk modeling and multi-symbol monitoring within a unified interface.
The script visualizes relationships between moving averages, structural alignment across symbols and internally calculated strategy metrics.
It does not predict future price direction.
It does not provide discretionary trade calls.
It does not issue standalone buy or sell recommendations.
All calculations are rule-based and derived from internal strategy logic.
It is designed for research, observation and structured testing.
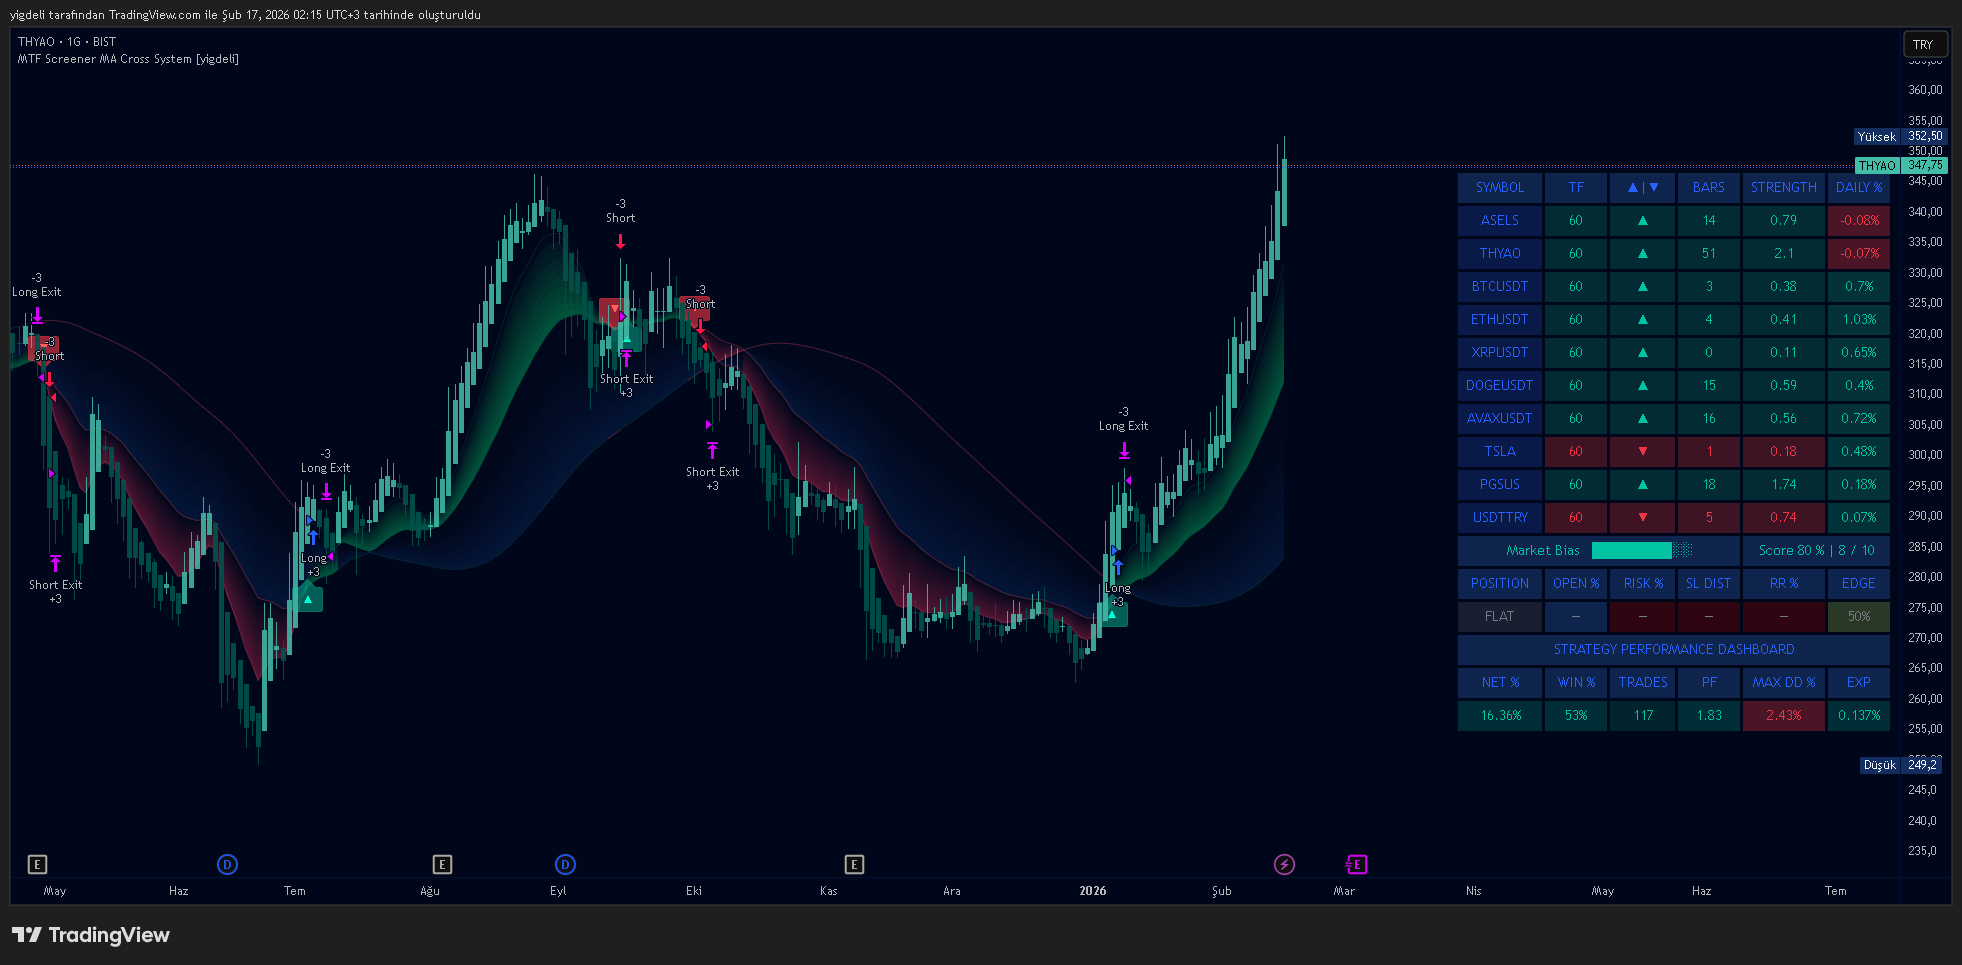
📷 Image – Complete System Layout
Complete system view including screener, gradient structure, risk panel and performance dashboard.
System Architecture
The system is built around three moving averages:
• Fast EMA
• Medium EMA
• Slow HMA
Users can select between different structural cross relationships:
• Fast vs Medium
• Fast vs Slow
• Medium vs Slow
A higher timeframe filter is included to display broader structural context relative to the selected cross configuration.
The script visualizes how these components interact under different parameter settings.
📷 Image – Cross Mode Comparison
Fast Mode
Medium Mode
Slow Mode
📷 Image – Higher Timeframe Filter Example
Higher timeframe filter provides structural context for rule-based entry conditions.
Risk Modeling & Trade Management
Two configurable risk models are available:
• Percentage-based stop and target
• ATR-based volatility-adjusted stop model
Trade management modes include:
• Fixed stop/target
• Break-even adjustment
• Partial position handling
• ATR-based trailing logic
These configurations allow comparative backtesting of different rule-based management approaches within the strategy framework.
No configuration implies future performance or profitability.
📷 Image – Risk Model Comparison
Comparison of stop placement under percentage-based risk mode.
(Stop level reflects percent-based configuration.)
Comparison of stop placement under ATR-based risk mode.
(Stop level reflects ATR-based configuration.)
📷 Image – Management Mode Comparison
Advanced (Break-even + Trailing)
Example of break-even activation followed by ATR-based trailing stop adjustment under Advanced management mode.
Basic
Example of fixed stop and target under Basic management mode.
Multi-Symbol Screener & Market Alignment
The integrated screener supports monitoring up to 10 symbols with independent timeframe selection.
Displayed metrics include:
• Directional state based on selected cross configuration
• Bars since last cross
• Relative distance between moving averages
• Daily percentage change
An alignment score summarizes the distribution of directional states across enabled symbols.
This score is descriptive and does not indicate or forecast market direction.
📷 Image – Screener, Alignment & Dashboard Overview
Live Risk Monitoring Panel
When a position is active, the system displays:
• Open position change (%)
• Initial risk exposure (%)
• Distance to stop level
• Risk/reward progression (%)
• Composite normalized metric (normalized scale)
Values are calculated from internal strategy data and visualized using a structured scale.
These metrics reflect current strategy state and are informational.
Strategy Performance Dashboard
The dashboard summarizes historical backtest metrics, including:
• Net result percentage
• Win rate
• Total trades
• Profit factor
• Maximum drawdown
• Expectancy
All values are derived from historical strategy calculations.
Historical performance does not represent future performance.
Gradient Wave Visualization
A layered gradient engine visually represents the positional relationship between the three moving averages.
Active cross zones and neutral structural regions are differentiated through a multi-step interpolation system.
The visualization reflects internal calculations and does not forecast or anticipate price movement.
📷 Image – Gradient Wave Structure
Layered gradient structure representing the relative positioning of the three moving averages.
Customization
📷 Image – Gradient Color Layering Example
Layered gradient fill between moving averages showing active and neutral structural color zones.
The script allows configuration of:
• Moving average lengths
• Cross mode selection
• Risk parameters
• Trade management mode
• Screener symbols and timeframes
• Table position and size
• Color settings
All components are adjustable without modifying the core structure.
How To Use
Select a cross mode according to the structural relationship you wish to observe.
Configure the higher timeframe filter if broader structural context is required.
Adjust risk model and management settings for comparative testing.
Enable screener symbols to monitor multi-instrument structural alignment.
Observe displayed metrics and historical calculations during testing.
The script operates strictly on predefined rules and does not replace independent analysis.
Notes
This script is provided for analytical and educational purposes.
It does not predict market direction.
It does not provide investment advice.
It does not guarantee performance or profitability.
Users are responsible for their own analysis, testing and risk management decisions.
Disclaimer
This script is a rule-based analytical tool.
It is not a financial advisory service and does not provide personalized investment guidance.
All strategy calculations are based on historical data and predefined logic.
Market conditions may vary, and users should perform independent analysis before making trading decisions.
Related Products
100% This Pine Script™ code is subject
The Apex Trend & Liquidity Master is a hybrid trading system designed to align traders with the dominant market trend while identifying key structural price levels. Unlike simple moving average crossovers or standalone support/resistance tools, this script integrates a volatility-adaptive "Trend Cloud" with a "Smart Liquidity" engine.
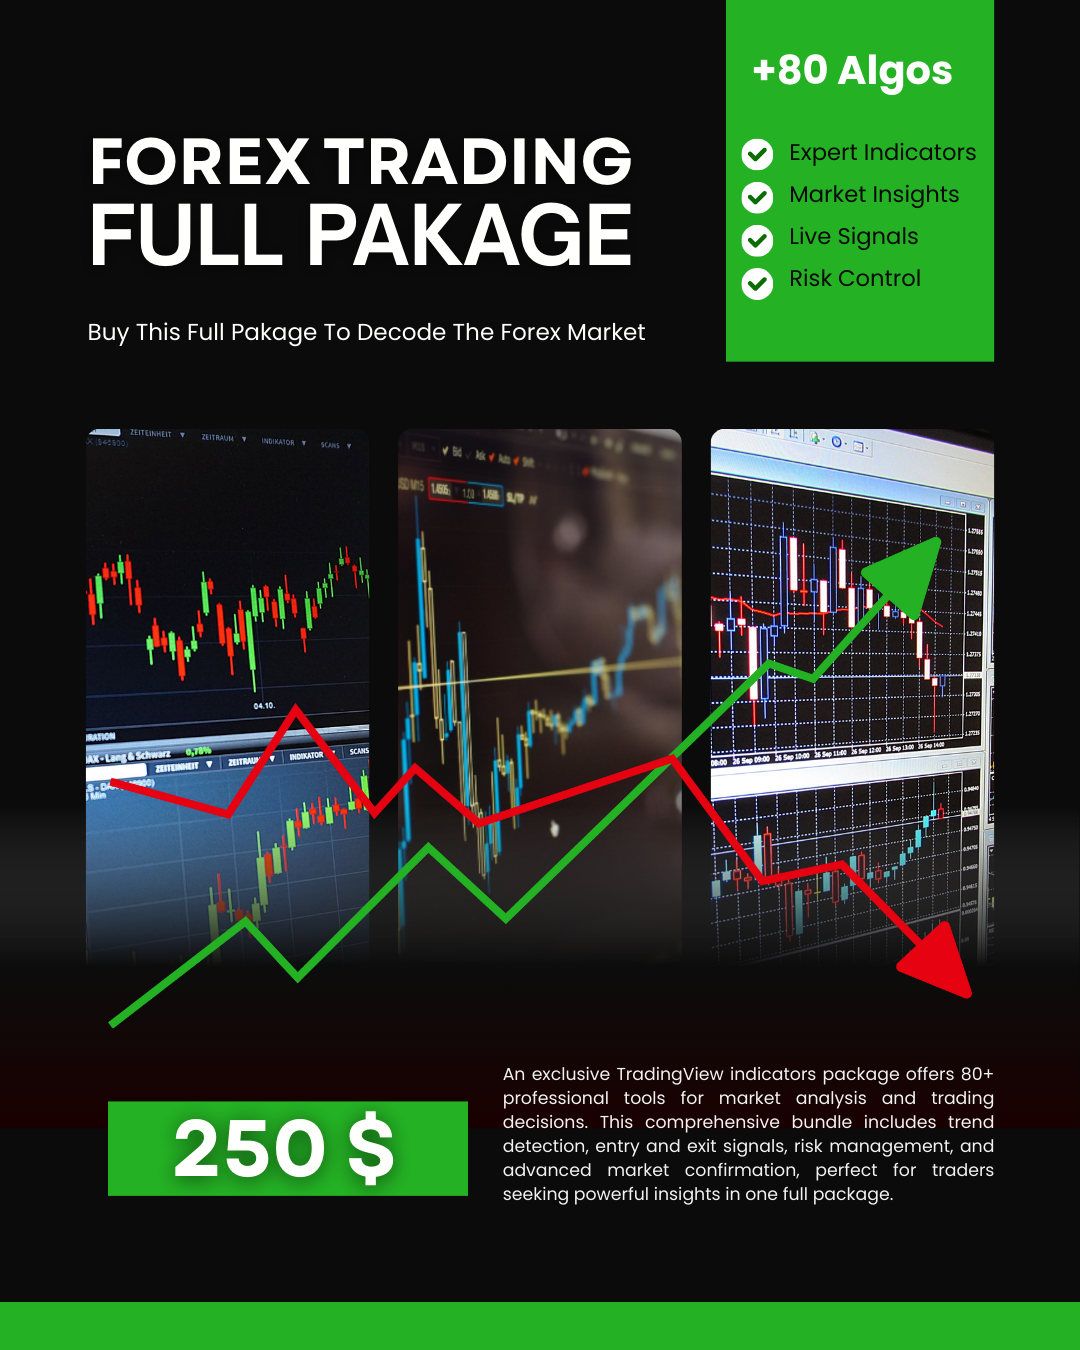
80+ Pro TradingView Indicators Bundle – Trade Smarter with One Powerful System
An exclusive TradingView indicators package featuring 80+ professional tools designed for precise market analysis and smarter trading decisions. This all-in-one bundle covers trend detection, entry and exit signals, risk management, and advanced market confirmation—ideal for traders who want powerful insights in one premium package.
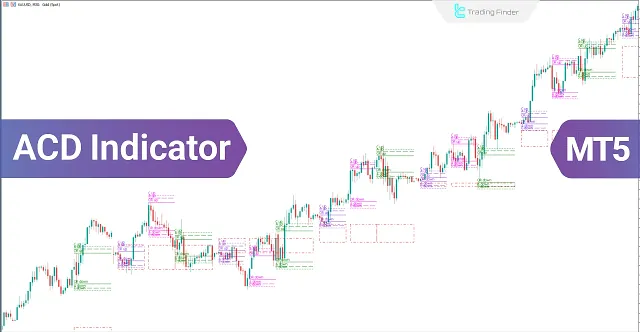
ACD Indicator for MetaTrader 5 Download - Free
The ACD indicator is a technical analysis tool in MetaTrader 5 developed by Mark Fisher and can also be used as a trading strategy. This tool is highly suitable for detecting daily price trends.
Advanced Gold Trading V6.4 EA MT4
Advanced Gold Trading V6.4 EA MT4 CATEGORY: MT4 EXPERTS
Advanced Hedge EA V4.0 MT4
Discover the Advanced Hedge EA V4.0 for MT4. This powerful automated trading tool helps users manage multiple hedged positions while optimizing profits and minimizing risks. Perfect for Forex traders who seek a reliable and sophisticated hedging strategy. CATEGORY: MT4 EXPERTS
AI Gen XII EA V2.5 MT4
A sophisticated AI-driven AI Gen XII EA V2.5 that leverages machine learning for pattern prediction and high-frequency trading on MT4.