
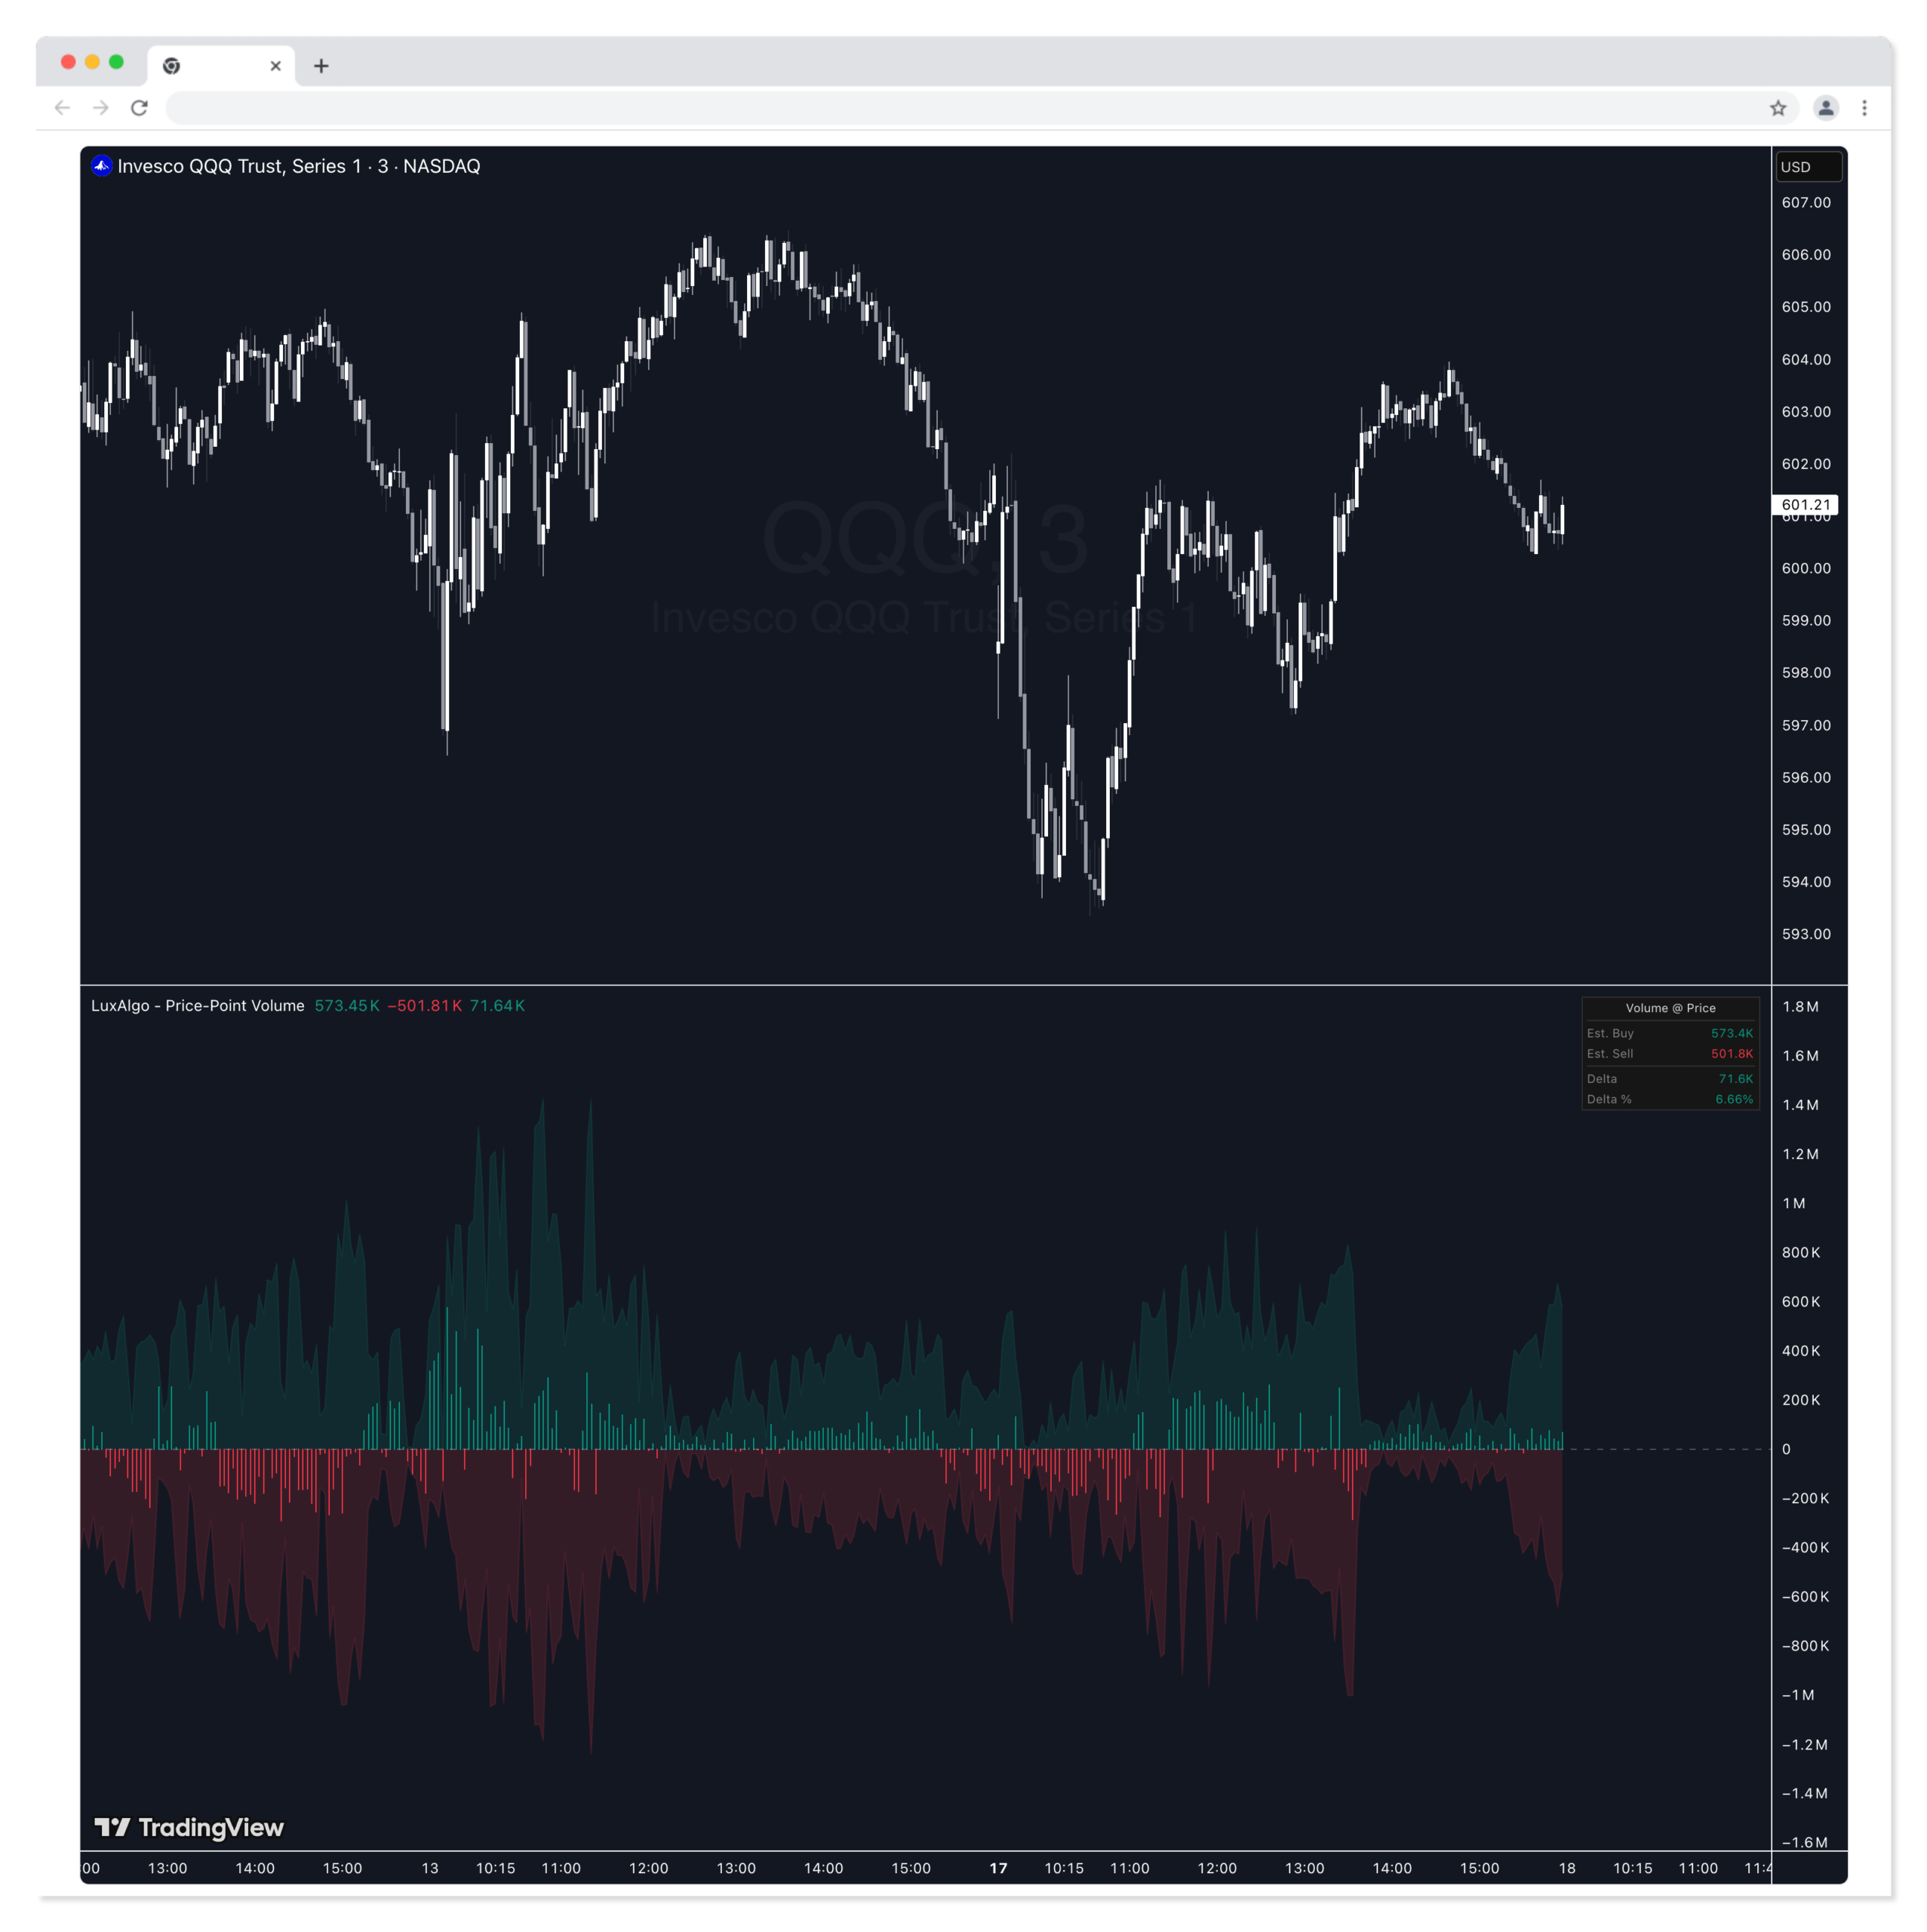
Price-Point Volume Oscillator [LuxAlgo]
The Price-Point Volume Oscillator indicator estimates the volume distribution at the current price level by analyzing historical bars that intersect with the current market price.
The Price-Point Volume Oscillator indicator estimates the volume distribution at the current price level by analyzing historical bars that intersect with the current market price.
🔶 USAGE
This tool provides a unique perspective on volume by filtering historical price action to show only the volume that occurred when the price was at its current level. This helps traders identify whether the current price point has historically been a zone of high buying pressure, heavy selling, or balanced distribution.
The indicator consists of several visual components:
- Buy/Sell Volume Areas: The background shows the estimated buying volume (green area) and selling volume (red area) accumulated at the current price over the lookback period.
- Volume Delta Histogram: The central histogram represents the net difference (Delta) between buy and sell volume. A green histogram indicates a net positive buying bias at the current price, while a red histogram indicates a net negative selling bias.
- Dashboard: A real-time table providing specific metrics, including estimated Buy/Sell totals, the net Delta, and the Delta Percentage.
Traders can use this oscillator to confirm support or resistance levels. For example, if the price approaches a previous level and the Delta Histogram shows significant buying volume at that specific price point, it may suggest strong historical demand.
🔶 DETAILS
The script operates by looping through a user-defined lookback window. For every historical bar, it checks if the current close price falls within that bar’s High-Low range. If it does, the volume from that historical bar is “allocated” to the current price level.
To differentiate between buying and selling volume, the script uses a ratio based on where the historical bar closed relative to its range. If a historical bar closed near its high, a larger portion of its volume is attributed to “Buy Volume” at the current price.
🔶 SETTINGS
🔹 Settings
- Lookback Window: Determines the number of historical bars the indicator analyzes to find price intersections. A larger window provides a more comprehensive historical view but requires more calculations.
🔹 Visuals
- Show Dashboard: Toggles the visibility of the real-time statistics table.
- Position: Controls where the dashboard is anchored on the chart (Top Right, Bottom Right, or Bottom Left).
- Size: Adjusts the text and table size of the dashboard to fit different screen resolutions.
Related Products
100% This Pine Script™ code is subject
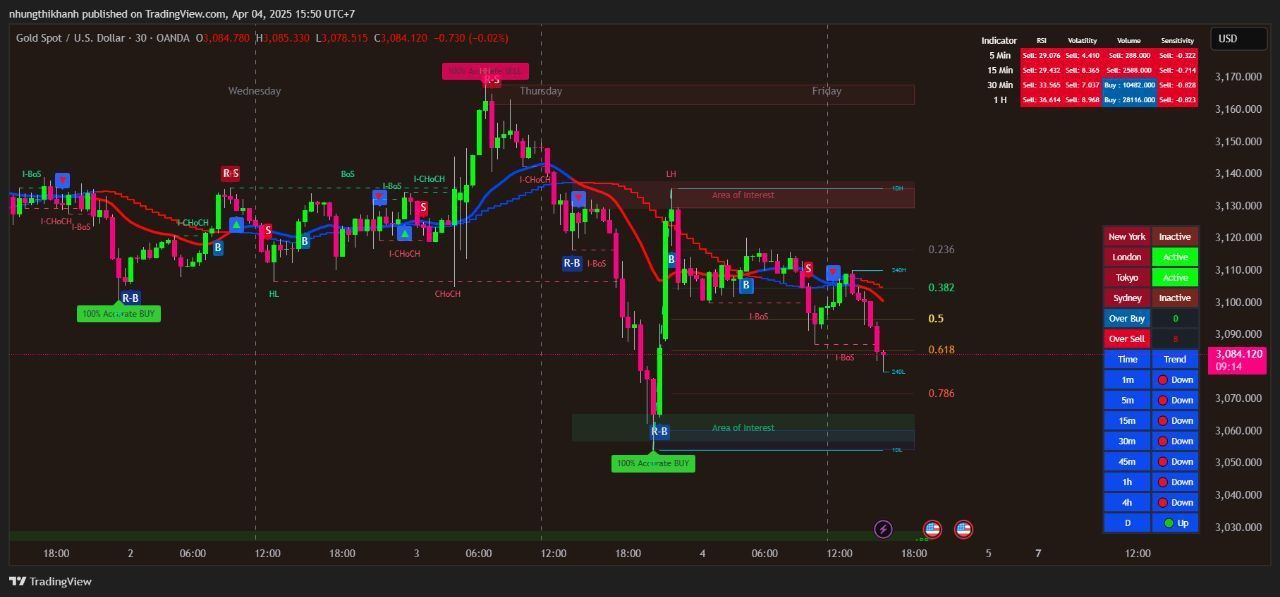
The Apex Trend & Liquidity Master is a hybrid trading system designed to align traders with the dominant market trend while identifying key structural price levels. Unlike simple moving average crossovers or standalone support/resistance tools, this script integrates a volatility-adaptive "Trend Cloud" with a "Smart Liquidity" engine.
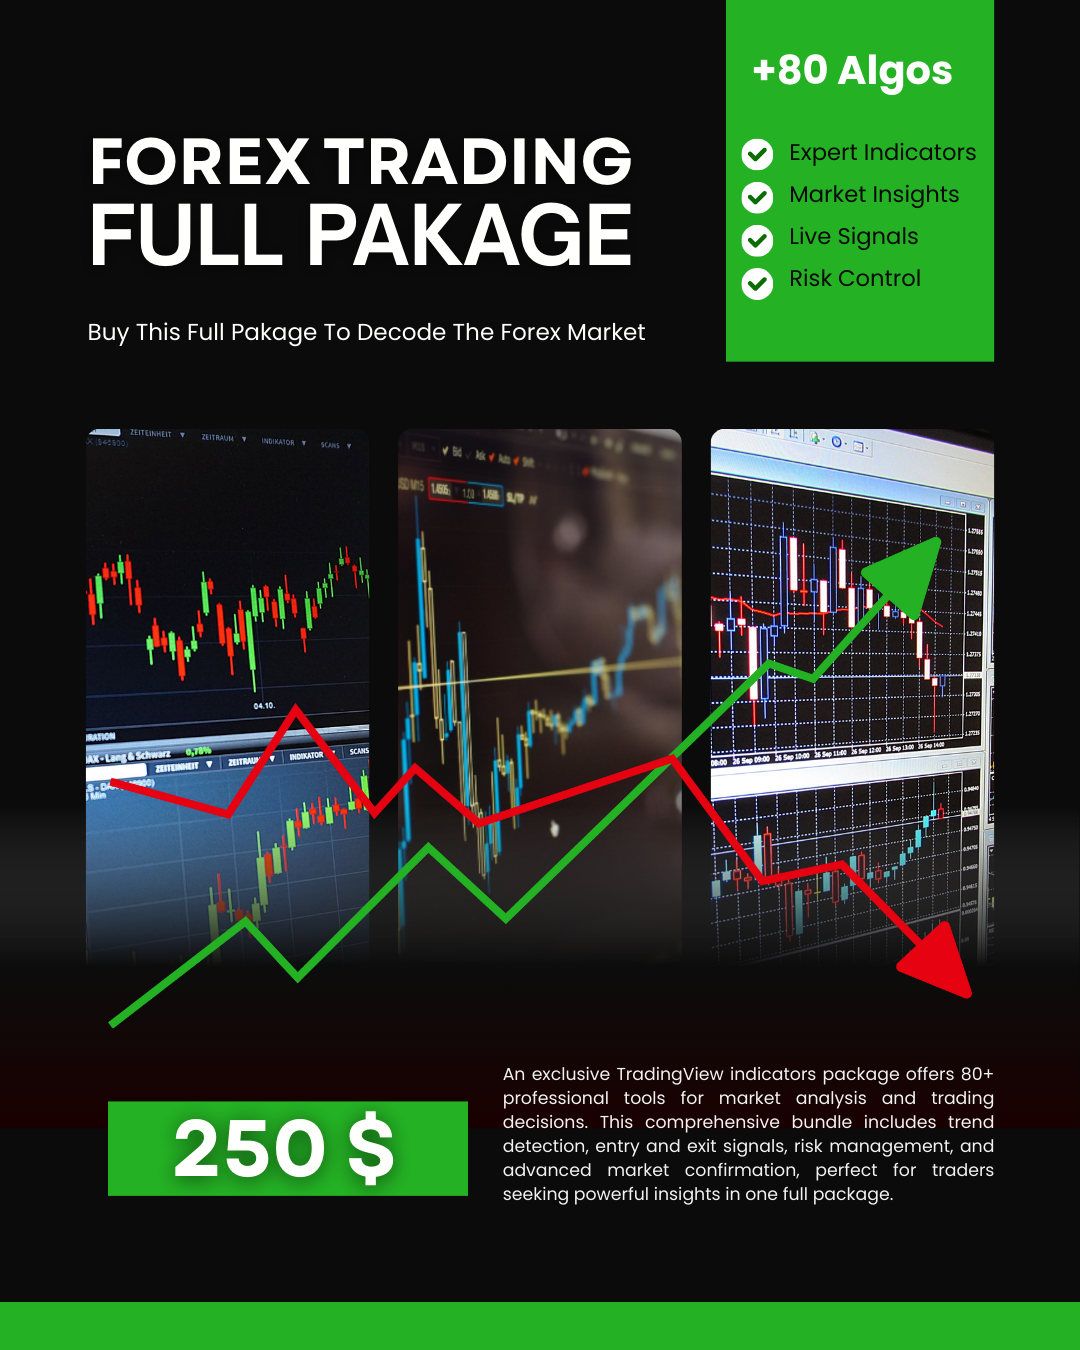
80+ Pro TradingView Indicators Bundle – Trade Smarter with One Powerful System
An exclusive TradingView indicators package featuring 80+ professional tools designed for precise market analysis and smarter trading decisions. This all-in-one bundle covers trend detection, entry and exit signals, risk management, and advanced market confirmation—ideal for traders who want powerful insights in one premium package.
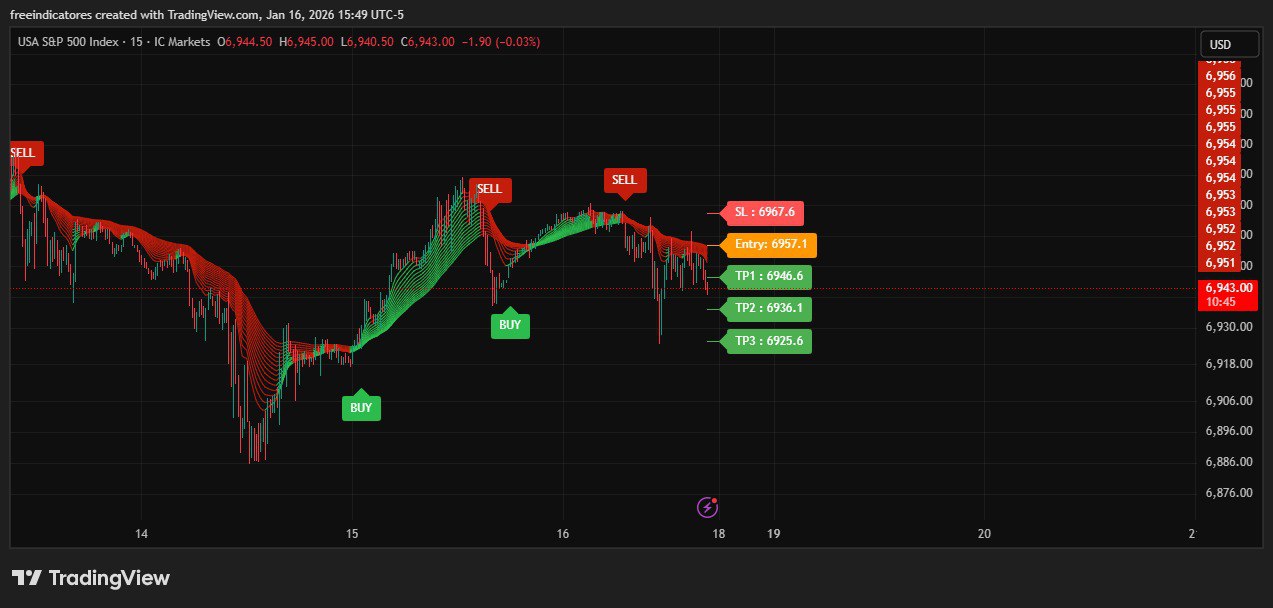
AI Signals Remastered
Signal Generation: Uses EMA clusters and a modified Supertrend (Keltner-based) to identify trends
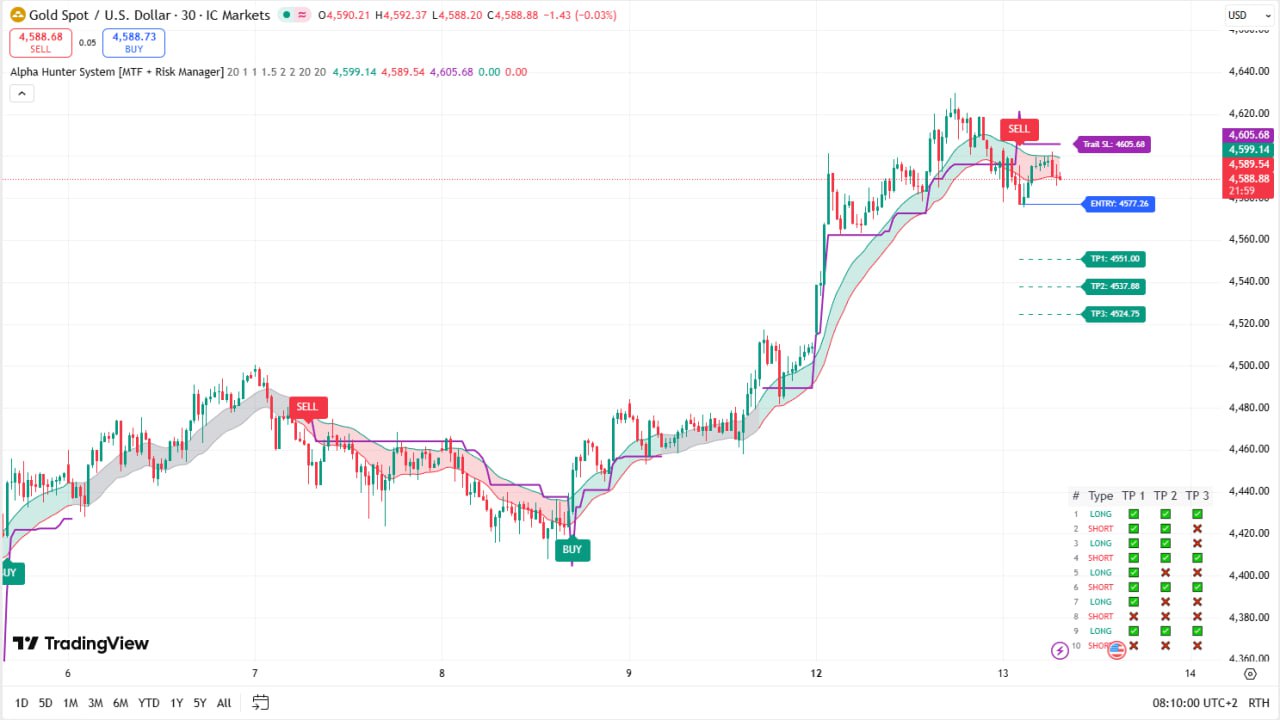
Alpha Hunter System (MTF + Risk Manager) – Full Explanation
Alpha Hunter System is a comprehensive TradingView indicator designed to combine trend detection, multi-filter confirmation, and advanced risk management into a single trading system. It is suitable for Forex, Crypto, Indices, and Stocks, and works across multiple timeframes.
![Arbitrage Detector [LuxAlgo] Download Free](https://digitaltradehub.net/wp-content/uploads/2026/01/g6Uhg3kr.png)
Arbitrage Detector [LuxAlgo] Download Free
The Arbitrage Detector unveils hidden spreads in the crypto and forex markets. It compares the same asset on the main crypto exchanges and forex brokers and displays both prices and volumes on a dashboard, as well as the maximum spread detected on a histogram divided by four user-selected percentiles.
![Arbitrage Matrix [LuxAlgo]](https://digitaltradehub.net/wp-content/uploads/2026/02/Arbitrage-Matrix-LuxAlgo.png)
Arbitrage Matrix [LuxAlgo]
The Arbitrage Matrix is a follow-up to our Arbitrage Detector that compares the spreads in price and volume between all the major crypto exchanges and forex brokers for any given asset.