
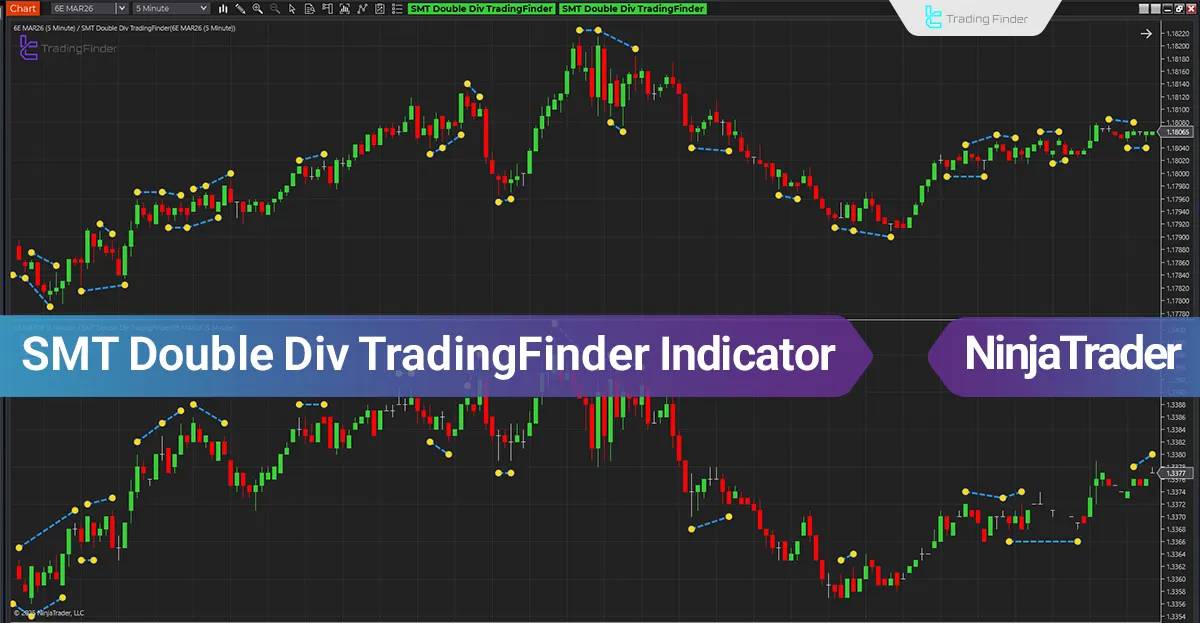
SMT Double Div TradingFinder Indicator in NinjaTrader – Free
The SMT Double Div TradingFinder Indicator by TradingFinder is built on the simultaneous analysis of price behavior across two correlated markets and focuses on structural discrepancies between highs and lows.
SMT Double Div TradingFinder Indicator at a Glance
Signals generated by the Smart Money Double Divergence Indicator by TradingFinder are displayed on the chart as connected lines between key price points.
This visual structure keeps the analyst’s focus directly on real price behavior and market structure logic and ties the decision making process to accurate analysis and reading of liquidity flow.
In this trading tool, circles act as markers of valid high and low pivots and form the basis for analyzing behavioral discrepancies between two correlated markets.
Additionally, the dashed line between these circles clearly illustrates the inability of one market to confirm a new high or low.
This visual combination makes the formation of Smart Money divergence identifiable without introducing additional noise, as follows:
- Connecting simultaneous pivots in two markets
- Displaying divergence through clearly defined colored line
- Precise differentiation between regular divergence and double divergence
- Ability to filter signals through indicator setting
Indicator in an Uptrend
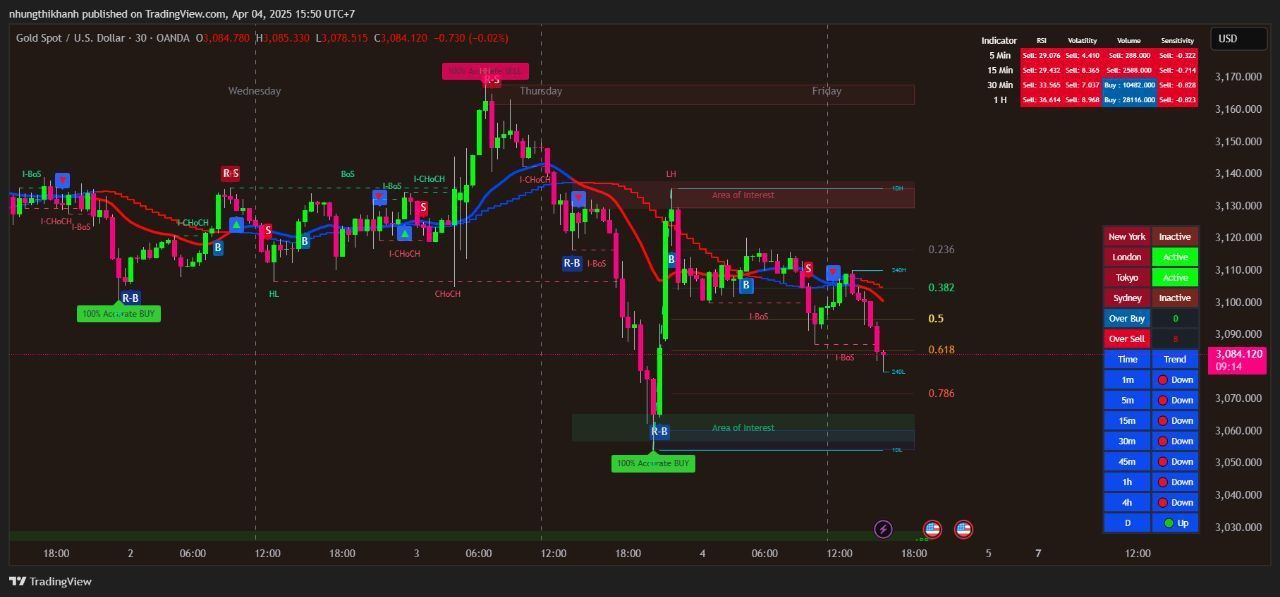
According to the image below, a bullish scenario based on Smart Money Double Divergence becomes active when the upper market records a lower low while the lower market fails to confirm a new low within the same time window.
The low pivot circles and the bullish dashed line display the behavioral discrepancy between the two correlated markets and reveal weakness in institutional selling pressure.
The alignment of this divergence with liquidity grabs below previous lows and price entry into the discount zone increases the validity of the bullish scenario.
Following this structure, continuation of price movement in the reference market signals the beginning of an accumulation phase and creates conditions for the formation of a controlled bullish leg.
Related Products
100% This Pine Script™ code is subject
The Apex Trend & Liquidity Master is a hybrid trading system designed to align traders with the dominant market trend while identifying key structural price levels. Unlike simple moving average crossovers or standalone support/resistance tools, this script integrates a volatility-adaptive "Trend Cloud" with a "Smart Liquidity" engine.
80+ Pro TradingView Indicators Bundle – Trade Smarter with One Powerful System
An exclusive TradingView indicators package featuring 80+ professional tools designed for precise market analysis and smarter trading decisions. This all-in-one bundle covers trend detection, entry and exit signals, risk management, and advanced market confirmation—ideal for traders who want powerful insights in one premium package.
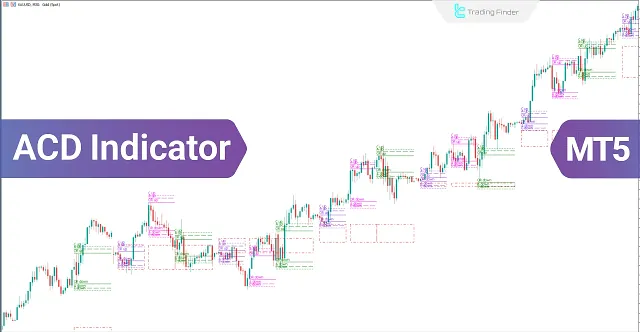
ACD Indicator for MetaTrader 5 Download - Free
The ACD indicator is a technical analysis tool in MetaTrader 5 developed by Mark Fisher and can also be used as a trading strategy. This tool is highly suitable for detecting daily price trends.
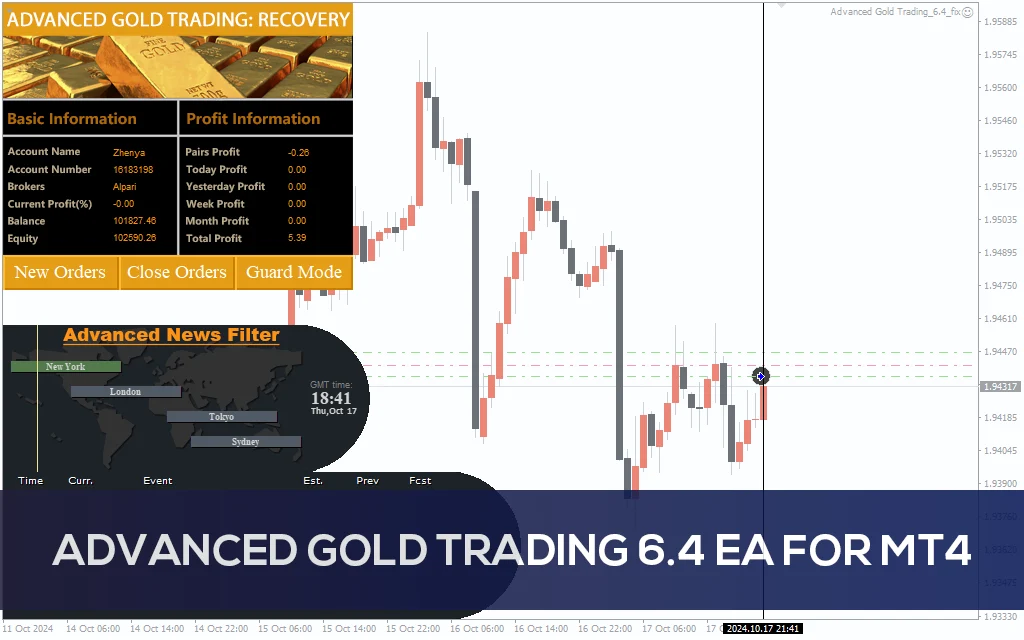
Advanced Gold Trading V6.4 EA MT4
Advanced Gold Trading V6.4 EA MT4 CATEGORY: MT4 EXPERTS
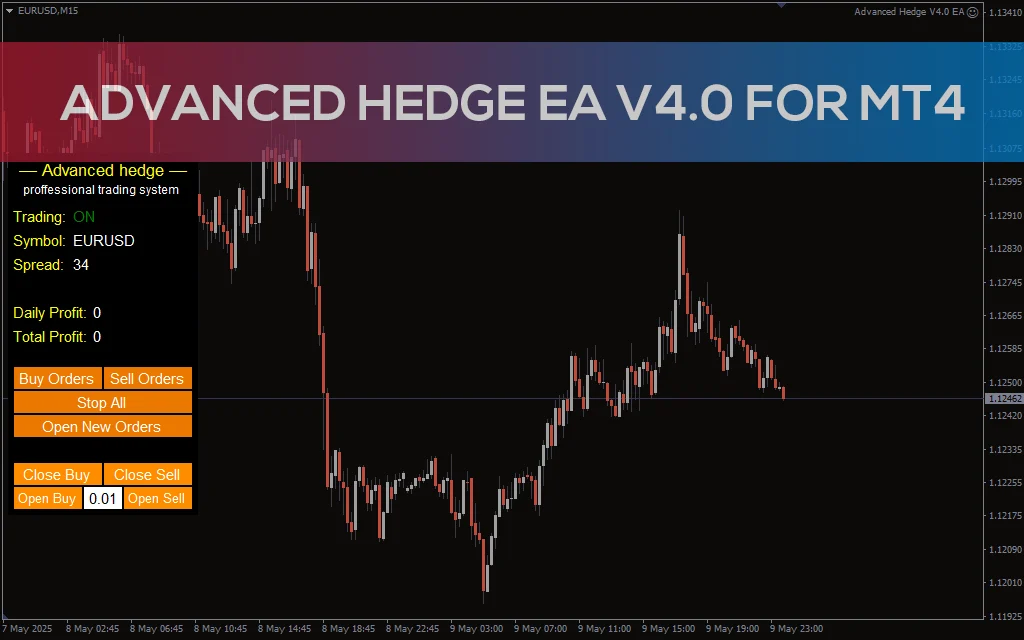
Advanced Hedge EA V4.0 MT4
Discover the Advanced Hedge EA V4.0 for MT4. This powerful automated trading tool helps users manage multiple hedged positions while optimizing profits and minimizing risks. Perfect for Forex traders who seek a reliable and sophisticated hedging strategy. CATEGORY: MT4 EXPERTS
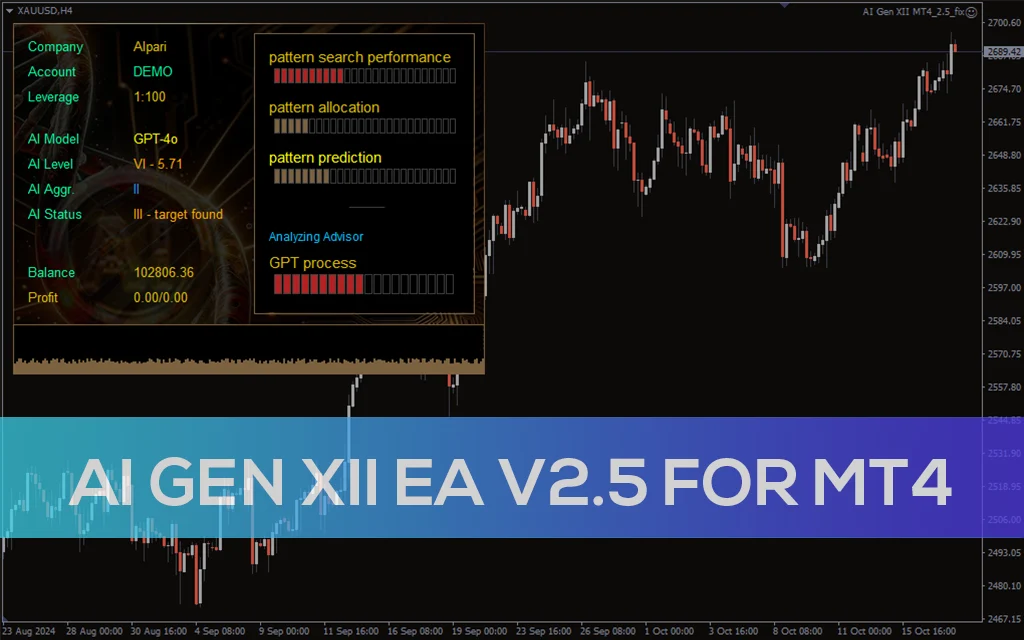
AI Gen XII EA V2.5 MT4
A sophisticated AI-driven AI Gen XII EA V2.5 that leverages machine learning for pattern prediction and high-frequency trading on MT4.