
Volume-Weighted Price Z-Score [QuantAlgo]
The Volume-Weighted Price Z-Score indicator quantifies price deviations from volume-weighted equilibrium using statistical standardization. It combines volume-weighted moving average analysis with logarithmic deviation measurement and volatility normalization to identify when prices have moved to statistically extreme levels relative to their volume-weighted baseline, helping traders and investors spot potential mean reversion opportunities across multiple timeframes.
How It Works
The indicator’s core methodology lies in its volume-weighted statistical approach, where price displacement is measured through normalized deviations from volume-weighted price levels:
Pine Script®
volumeWeightedAverage = ta.vwma(priceSource, lookbackPeriod)
logDeviation = math.log(priceSource / volumeWeightedAverage)
volatilityMeasure = ta.stdev(logDeviation, lookbackPeriod)
The script uses logarithmic transformation to capture proportional price changes rather than absolute differences, ensuring equal treatment of percentage moves regardless of price level:
Pine Script®
rawZScore = logDeviation / volatilityMeasure
zScore = ta.ema(rawZScore, smoothingPeriod)
First, it establishes the volume-weighted baseline which gives greater weight to price levels where significant trading occurred, creating a more representative equilibrium point than simple moving averages.
Then, the logarithmic deviation measurement converts the price-to-average ratio into a normalized scale:
Pine Script®
logDeviation = math.log(priceSource / volumeWeightedAverage)
Next, statistical normalization is achieved by dividing the deviation by its own historical volatility, creating a standardized z-score that measures how many standard deviations the current price sits from the volume-weighted mean.
Finally, EMA smoothing filters noise while preserving the signal’s responsiveness to genuine market extremes:
Pine Script®
rawZScore = logDeviation / volatilityMeasure
zScore = ta.ema(rawZScore, smoothingPeriod)
This creates a volume-anchored statistical oscillator that combines price-volume relationship analysis with volatility-adjusted normalization, providing traders with probabilistic insights into market extremes and mean reversion potential based on standard deviation thresholds.
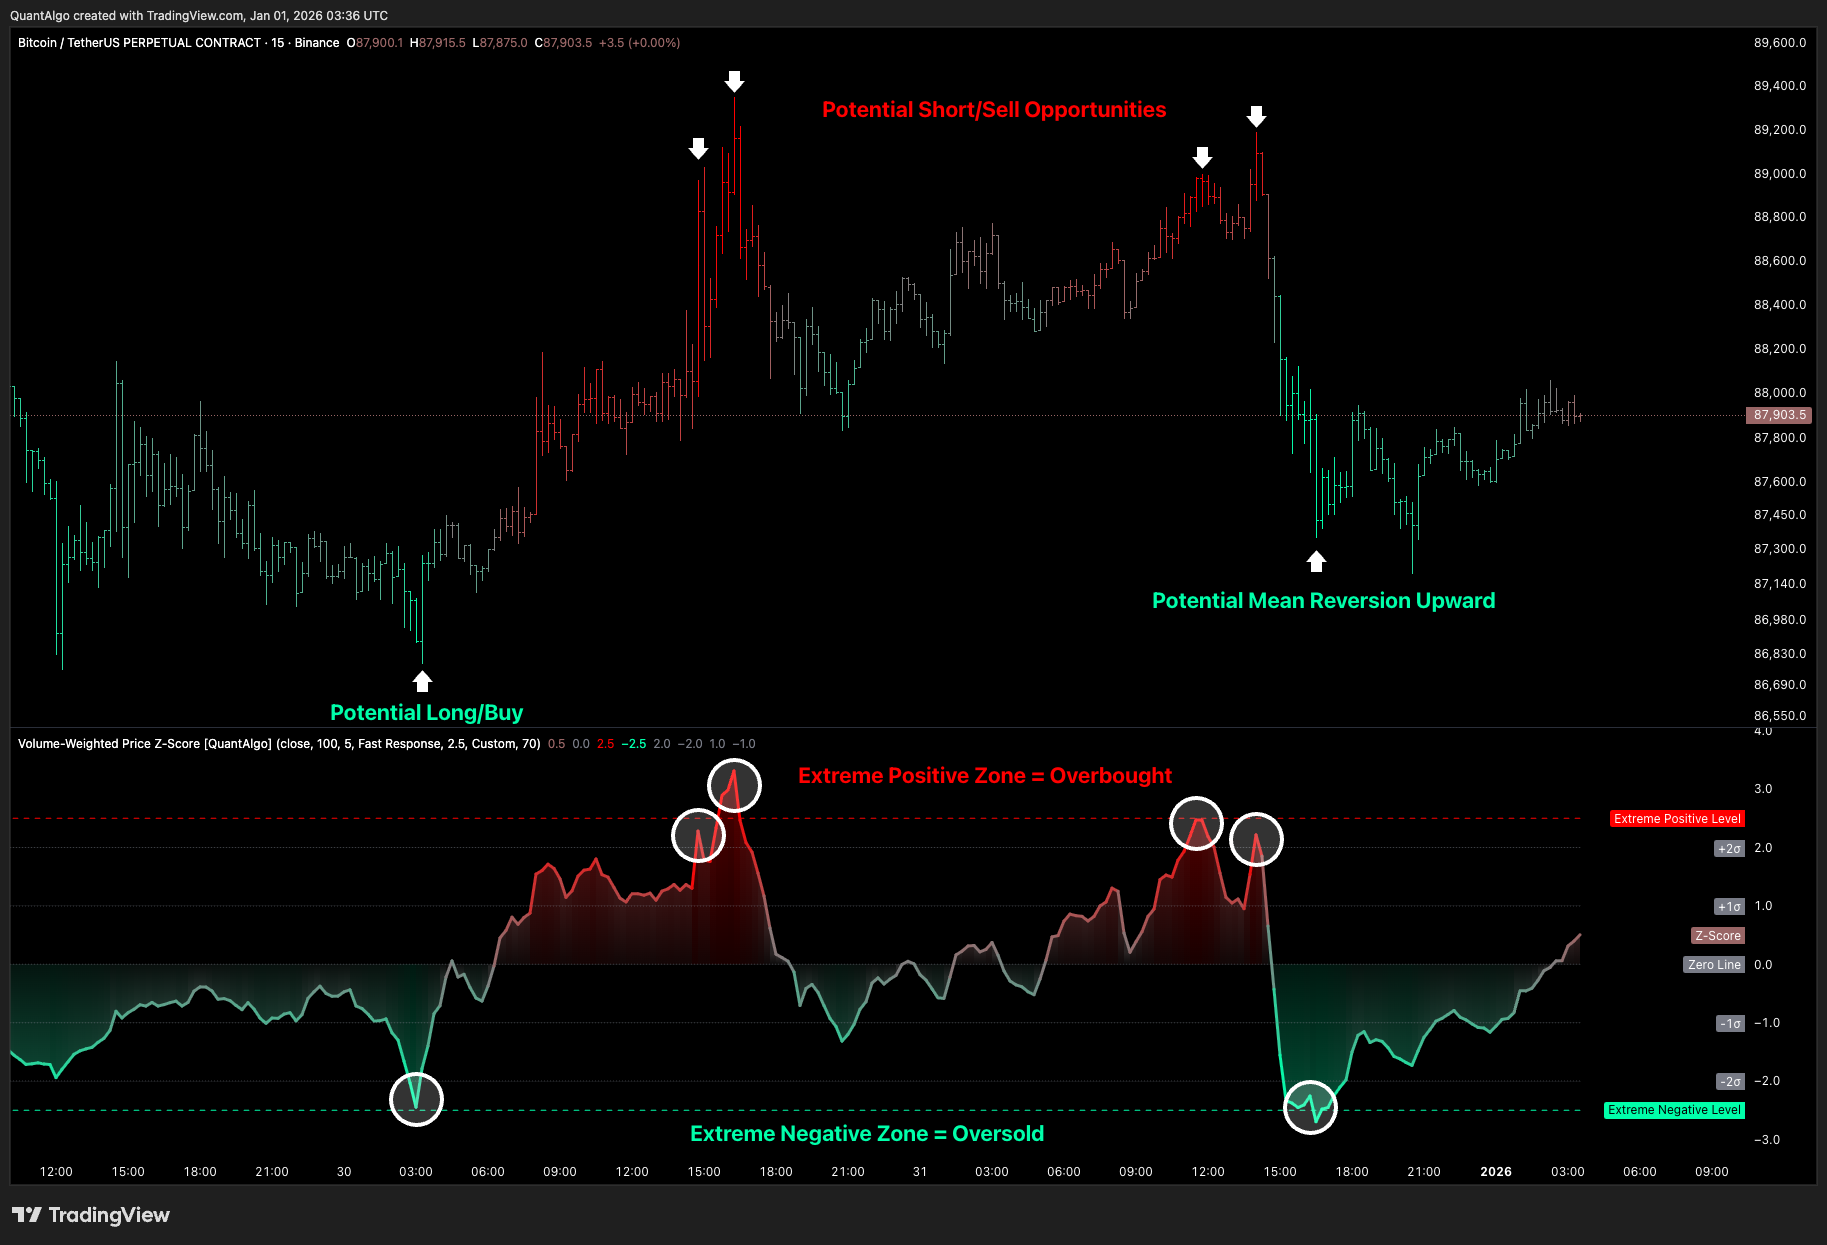
snapshot
🟢 Signal Interpretation
▶ Positive Values (Above Zero): Price trading above volume-weighted average indicating potential overvaluation relative to volume-weighted equilibrium = Caution on longs, potential mean reversion downward = Short/sell opportunities
▶ Negative Values (Below Zero): Price trading below volume-weighted average indicating potential undervaluation relative to volume-weighted equilibrium = Caution on shorts, potential mean reversion upward = Long/buy opportunities
▶ Zero Line Crosses: Mean reversion transitions where price crosses back through volume-weighted equilibrium, indicating shift from overvalued to undervalued (or vice versa) territory
snapshot
▶ Extreme Positive Zone (Above +2.5σ default): Statistically rare overvaluation representing 98.8%+ confidence level deviation, indicating extremely stretched bullish conditions with high mean reversion probability = Strong correction warning/short signal
▶ Extreme Negative Zone (Below -2.5σ default): Statistically rare undervaluation representing 98.8%+ confidence level deviation, indicating extremely stretched bearish conditions with high mean reversion probability = Strong buying opportunity signal
▶ ±1σ Reference Levels: Moderate deviation zones (±1 standard deviation) marking common price fluctuation boundaries where approximately 68% of price action occurs under normal distribution
▶ ±2σ Reference Levels: Significant deviation zones (±2 standard deviations) marking unusual price extremes where approximately 95% of price action should be contained under normal conditions
🟢 Features
▶ Preconfigured Presets: Three optimized parameter sets accommodate different analytical approaches, instruments and timeframes. “Default” provides balanced statistical measurement suitable for swing trading and daily/4-hour analysis, offering deviation detection with moderate responsiveness to price dislocations. “Fast Response” delivers heightened sensitivity optimized for intraday trading and scalping on 15-minute to 1-hour charts, using shorter statistical windows and minimal smoothing to capture rapid mean reversion opportunities as they develop. “Smooth Trend” offers conservative extreme identification ideal for position trading on daily to weekly charts, employing extended statistical periods and heavy noise filtering to isolate only the most significant market extremes.
snapshot
▶ Built-in Alerts: Seven alert conditions enable comprehensive automated monitoring of statistical extremes and mean reversion events. Extreme Overbought triggers when z-score crosses above the extreme threshold (default +2.5σ) signaling rare overvaluation, Extreme Oversold activates when z-score crosses below the negative extreme threshold (default -2.5σ) signaling rare undervaluation. Exit Extreme Overbought and Exit Extreme Oversold alert when prices begin reverting from these statistical extremes back toward the mean. Bullish Mean Reversion notifies when z-score crosses above zero indicating shift to overvalued territory, while Bearish Mean Reversion triggers on crosses below zero indicating shift to undervalued territory. Any Extreme Level provides a combined alert for any extreme threshold breach regardless of direction. These notifications allow you to capitalize on statistically significant price dislocations without continuous chart monitoring.
▶ Color Customization: Six visual themes (Classic, Aqua, Cosmic, Ember, Neon, plus Custom) accommodate different chart backgrounds and visual preferences, ensuring optimal contrast for identifying positive versus negative deviations across trading environments. The adjustable fill transparency control (0-100%) allows fine-tuning of the gradient area prominence between the z-score line and zero baseline, with higher opacity values creating subtle background context while lower values produce bold deviation emphasis. Optional bar coloring extends the z-score gradient directly to the indicator pane bars, providing immediate visual reinforcement of current deviation magnitude and direction without requiring reference to the plotted line itself.
Related Products
100% This Pine Script™ code is subject
The Apex Trend & Liquidity Master is a hybrid trading system designed to align traders with the dominant market trend while identifying key structural price levels. Unlike simple moving average crossovers or standalone support/resistance tools, this script integrates a volatility-adaptive "Trend Cloud" with a "Smart Liquidity" engine.
80+ Pro TradingView Indicators Bundle – Trade Smarter with One Powerful System
An exclusive TradingView indicators package featuring 80+ professional tools designed for precise market analysis and smarter trading decisions. This all-in-one bundle covers trend detection, entry and exit signals, risk management, and advanced market confirmation—ideal for traders who want powerful insights in one premium package.
AI Signals Remastered
Signal Generation: Uses EMA clusters and a modified Supertrend (Keltner-based) to identify trends
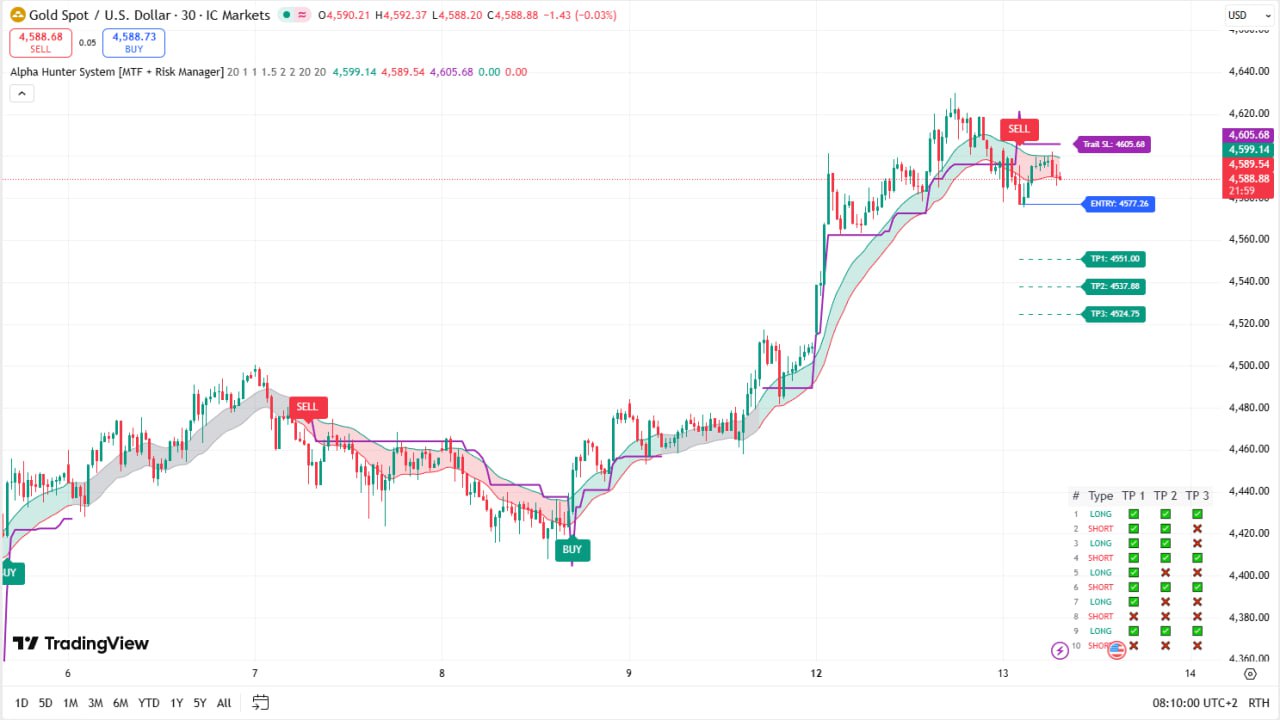
Alpha Hunter System (MTF + Risk Manager) – Full Explanation
Alpha Hunter System is a comprehensive TradingView indicator designed to combine trend detection, multi-filter confirmation, and advanced risk management into a single trading system. It is suitable for Forex, Crypto, Indices, and Stocks, and works across multiple timeframes.
![Arbitrage Detector [LuxAlgo] Download Free](https://digitaltradehub.net/wp-content/uploads/2026/01/g6Uhg3kr.png)
Arbitrage Detector [LuxAlgo] Download Free
The Arbitrage Detector unveils hidden spreads in the crypto and forex markets. It compares the same asset on the main crypto exchanges and forex brokers and displays both prices and volumes on a dashboard, as well as the maximum spread detected on a histogram divided by four user-selected percentiles.
![Arbitrage Matrix [LuxAlgo]](https://digitaltradehub.net/wp-content/uploads/2026/02/Arbitrage-Matrix-LuxAlgo.png)
Arbitrage Matrix [LuxAlgo]
The Arbitrage Matrix is a follow-up to our Arbitrage Detector that compares the spreads in price and volume between all the major crypto exchanges and forex brokers for any given asset.