
FXSSI.OrderBook Pro MT4 and MT5
One of the most powerful tools for market sentiment analysis, this indicator plots two histograms that represent the Open Orders and Open Positions of market participants.
FXSSI.OrderBook – Overview
Analyze the market sentiment directly in the MT4 and MT5 terminal with the advanced OrderBook indicator.
The indicator will allow you to:
The OrderBook indicator will become an indispensable assistant for any trader who practices trading against the market majority.
Many of our clients find this indicator indispensable, making it a crucial part of their market analysis toolkit.
OrderBook Indicator
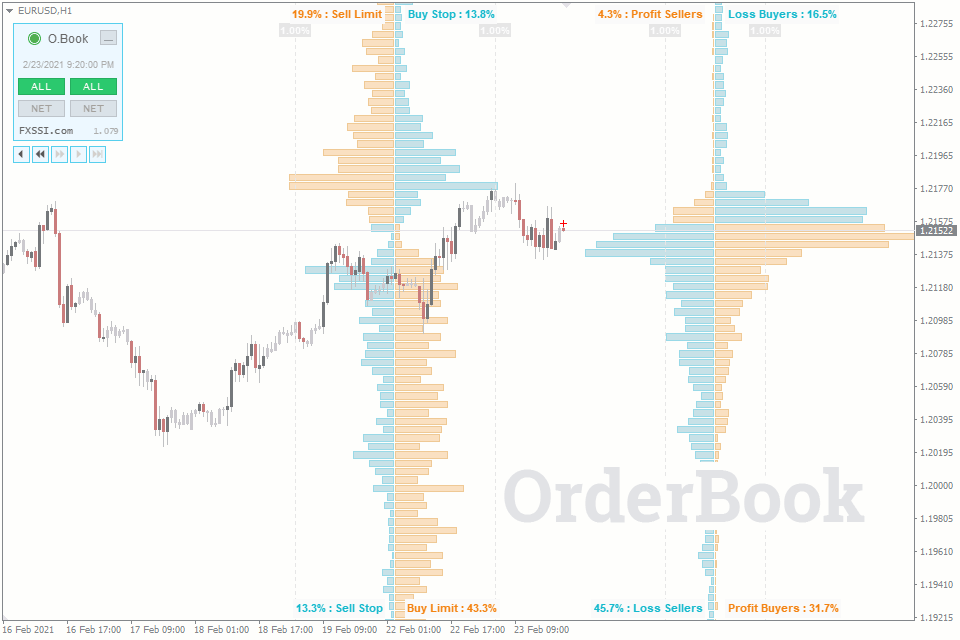
The OrderBook indicator displays open trades and pending orders of retail traders as a two-sided histogram. It is used for the comprehensive analysis of market sentiment for a particular financial instrument.
The OrderBook indicator consists of two parts:
The left order book further divide into quarters, each of which displays a specific order type, such as Sell Limit, Buy Stop, Profit Sellers or Loss Buyers, etc.
And the right histogram of OrderBook divides buyers and sellers into those in profit and those in loss.
By analyzing this kind of information and resorting to various patterns of the market crowd behavior, you can make complete trading decisions.
Trading With the OrderBook Indicator
First of all, you should understand that Order Book does not generate clear-cut signals like, for example, some indicators that draw arrows on the chart indicating Buy or Sell recommendations.
When it comes to the Order Book, the market analysis comes down to searching for existing or non-existing abnormal clusters among sellers and buyers.
The basic algorithm for the market analysis using the Order Book is as follows:

For Buy trades:

For Sell trades:
However, this doesn’t mean that you should immediately open a Sell trade when you see, for example, a cluster of winning buyers.
We can guarantee that at first, you’ll see things in the market that aren’t really there. With practice, you’ll learn to tell which signals are real and reliable.
Trading with the Order Book needs a bit more detailed analysis for each market situation. You should examine the market to figure out who might be trying to manipulate whom. Once you have an idea, you can then look for a trading opportunity.
If you’re interested in this indicator and you want to know more about it, our complete Order Book guide will help you understand the analysis technique and displayed data interpretation.
What Kind of Data Does the Indicator Show?
OrderBook is the visual representation of trading activity, namely, open trades, pending orders, and Stop orders.
At each price level, the trades are summed up and represented as a histogram. As a result, we get the following picture:

The picture shows the extended order book that includes all types of pending orders as well as open trades.
The original concept of the order book meant that only the first and fourth squares (i.e., only Limit orders) were displayed.
Adding other types of orders and forming a two-sided order book like in our case, was possible thanks to the customer base of a particular broker.
The ordinary stock exchanges cannot provide a two-sided order book since they don’t have the required information.
Indicator Features
The indicator was developed by a team of experienced traders and programmers, so it’s not only a program for data transfer but also a handy and effective tool for analyzing financial markets.
Here are some of the OrderBook indicator features:
Snapshot time. The panel shows the time of the current OrderBook snapshot. It’s actually the time when the data was last updated. If the label is blue, the history navigation mode is enabled.
History navigation. The indicator allows you to navigate the history of snapshots. The maximum history depth depends on the selected subscription plan.

Red cross mark. A cross mark on top of the candlestick chart indicates the price and time at which the Order Book snapshot was made. It is also used to rewind the history of snapshots.
Fast access to data. Switch between modes using the buttons on the indicator panel. You don’t have to go to the indicator settings to change the type of the displayed data.

The menu has the button to minimize the panel as well. You can set the minimized state of the panel as default in the indicator settings. It reduces the menu size in such a way as not to prevent you from making a candlestick analysis.
Four layouts. Simplified/classic, one-sided/two-sided. For more information, see the image below:

Auto settings. The indicator has a feature for the automatic detection of color scheme and time zone.
For your convenience, we have added the Automatic Indicators Update system. Now you only need to restart your terminal to get the latest versions. The indicator will inform you about it in a separate window.
Indicator Settings

OrderBook Settings Block
OrderBook Depth. It sets the number of horizontal columns of the histogram. The higher the value, the larger the height of the order book.
Layout. There are four layout options available:
Offset from the Right Side, Dist. between OrderBooks. Both parameters set the location of the histograms on the chart.
History Navigation Block
History Navigation. Enables/disables navigation through cast history.
Show Navigation Buttons when Minimized. Determines whether the rewinding panel will be displayed when the main one is minimized.
Fast Rewind Speed (in snapshots). Sets the step for fast rewinding. You can enter the value at your discretion. It is measured in bars.
OrderBook Scale Options
Show Scale on Chart. Enables/disables the vertical bar-scale of the histogram.
Orders/Positions – value width/value size. They determine how far the vertical scale lines will be drawn from the middle of the order book.
Indicator Panel Settings
Indicator Panel Settings:
Data to show by Default
Left Side/Right Side – Default Data. Sets the default data type for the simplified display.
Left Side/Right Side – Default Filter. Shows all data or the net default value.
Add All/Net Filters. Enable/Disable the net value mode.
Color Settings
Color Scheme. By default, the indicator will automatically detect the color scheme depending on the chart background. If necessary, select the desired color scheme from the list.
Related Products
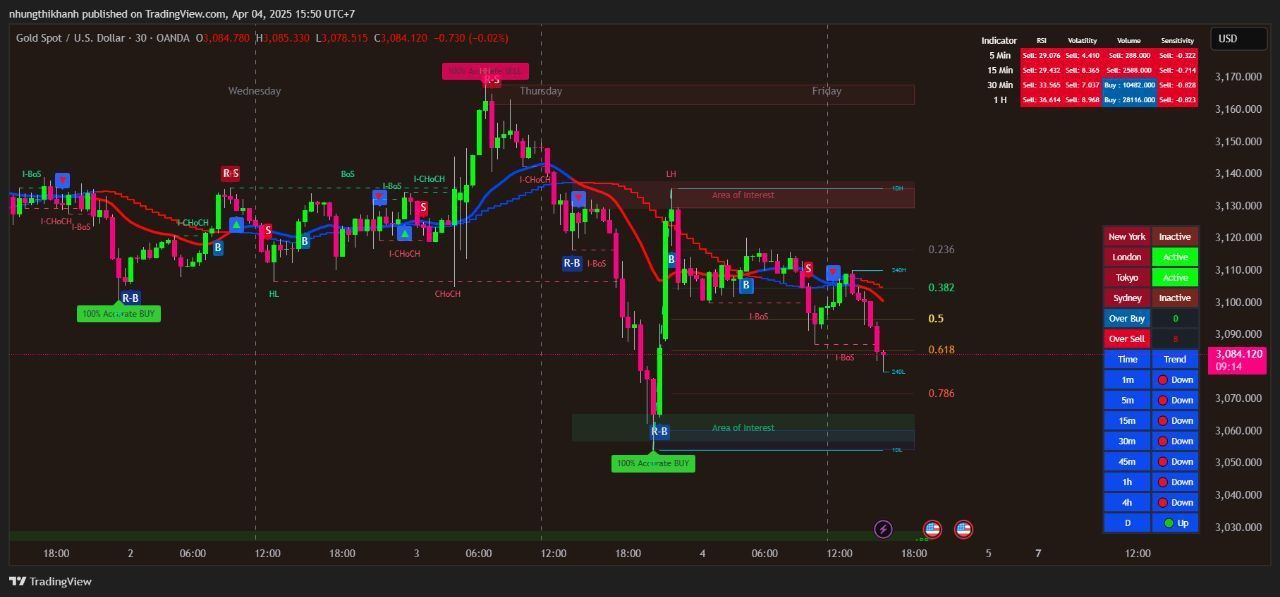
100% This Pine Script™ code is subject
The Apex Trend & Liquidity Master is a hybrid trading system designed to align traders with the dominant market trend while identifying key structural price levels. Unlike simple moving average crossovers or standalone support/resistance tools, this script integrates a volatility-adaptive "Trend Cloud" with a "Smart Liquidity" engine.
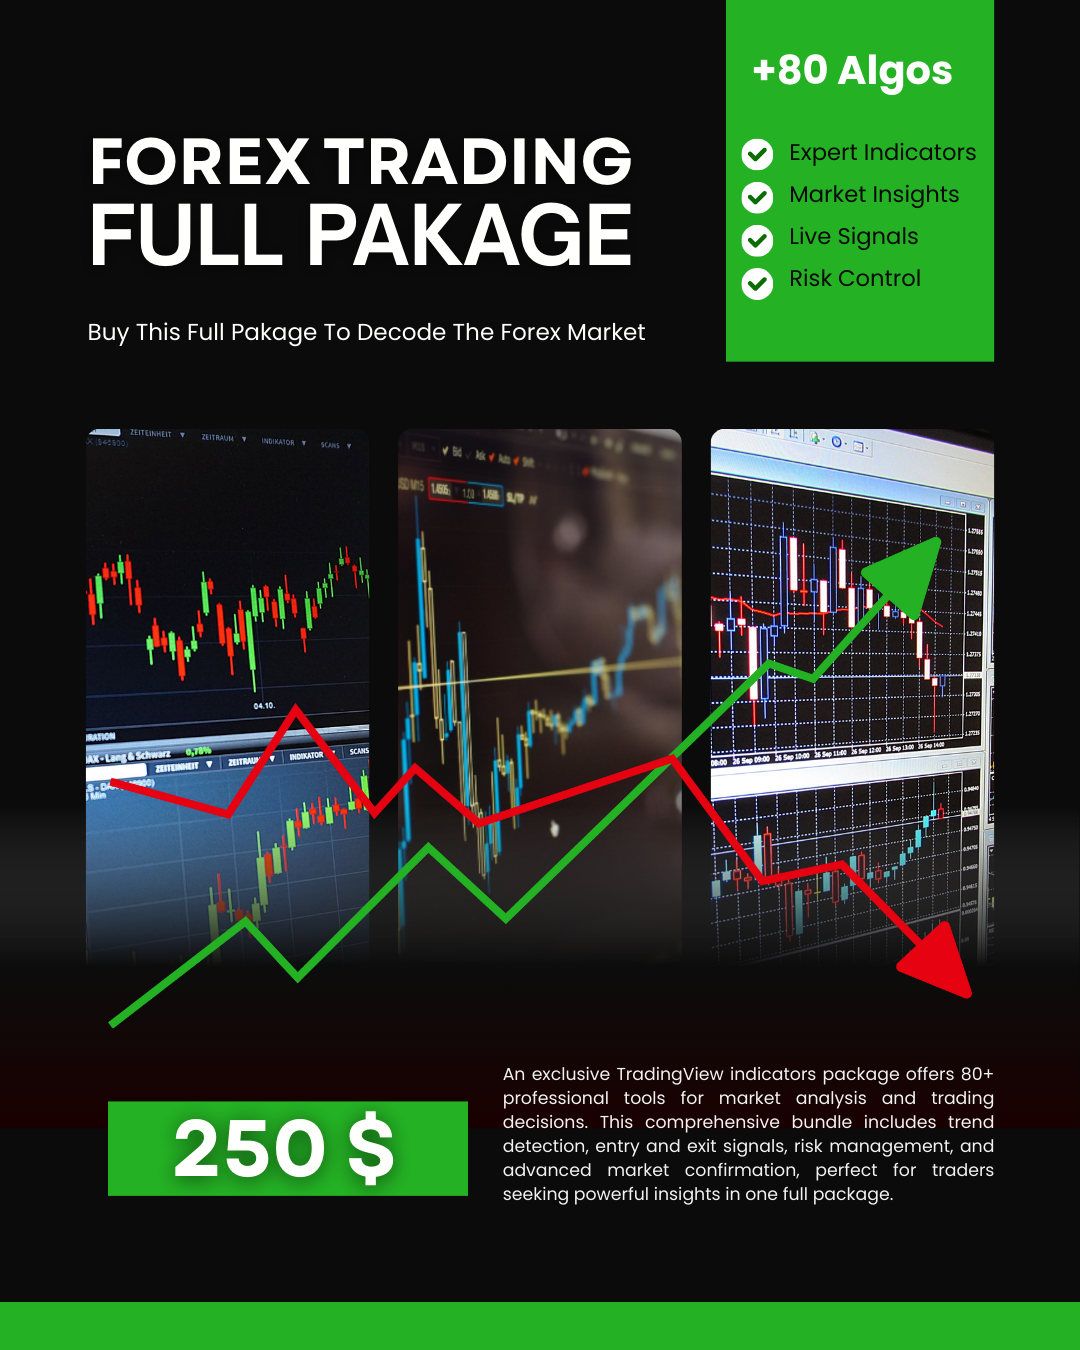
80+ Pro TradingView Indicators Bundle – Trade Smarter with One Powerful System
An exclusive TradingView indicators package featuring 80+ professional tools designed for precise market analysis and smarter trading decisions. This all-in-one bundle covers trend detection, entry and exit signals, risk management, and advanced market confirmation—ideal for traders who want powerful insights in one premium package.
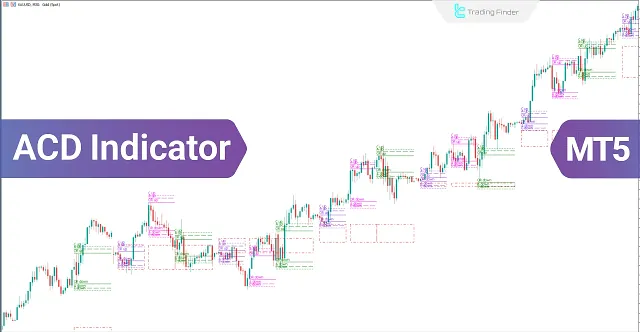
ACD Indicator for MetaTrader 5 Download - Free
The ACD indicator is a technical analysis tool in MetaTrader 5 developed by Mark Fisher and can also be used as a trading strategy. This tool is highly suitable for detecting daily price trends.
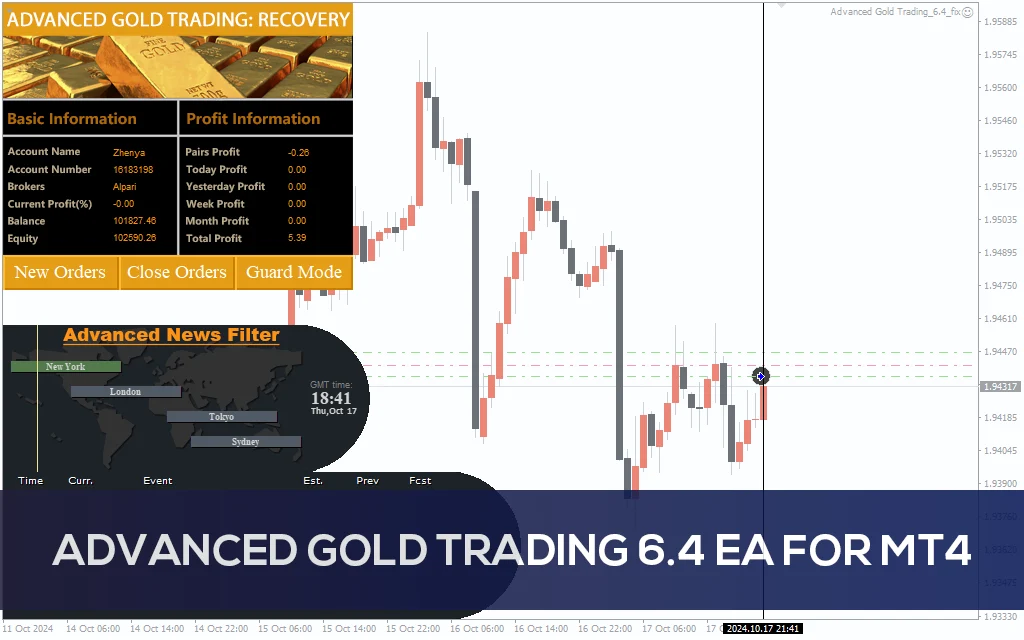
Advanced Gold Trading V6.4 EA MT4
Advanced Gold Trading V6.4 EA MT4 CATEGORY: MT4 EXPERTS
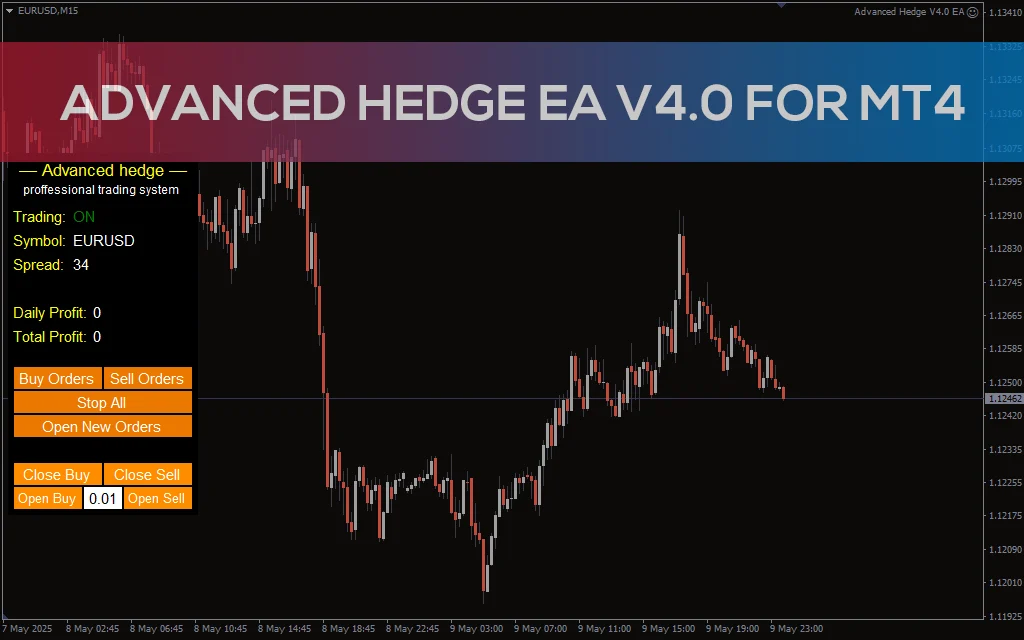
Advanced Hedge EA V4.0 MT4
Discover the Advanced Hedge EA V4.0 for MT4. This powerful automated trading tool helps users manage multiple hedged positions while optimizing profits and minimizing risks. Perfect for Forex traders who seek a reliable and sophisticated hedging strategy. CATEGORY: MT4 EXPERTS
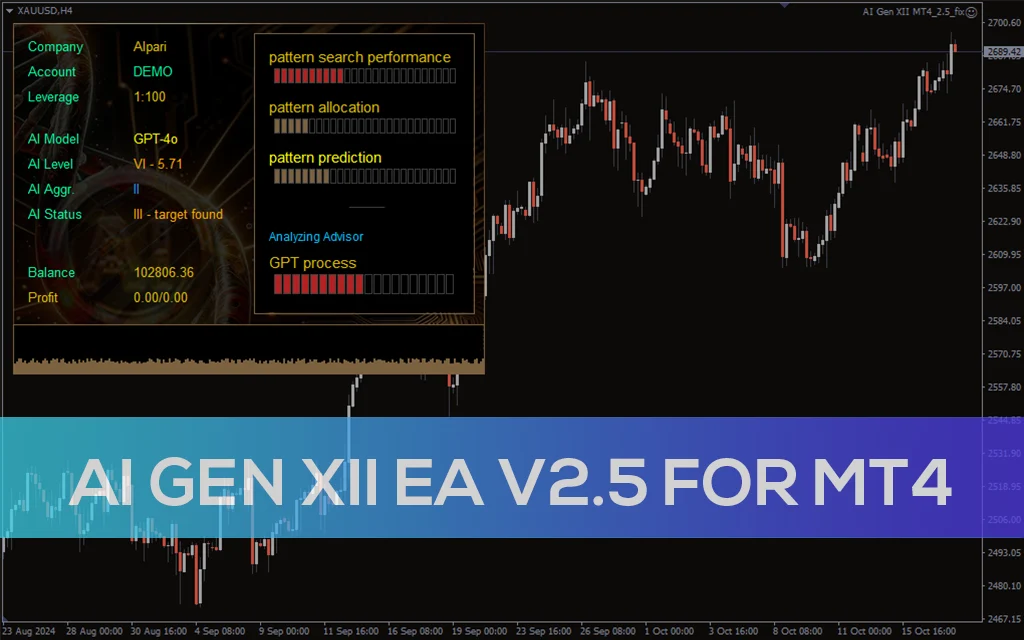
AI Gen XII EA V2.5 MT4
A sophisticated AI-driven AI Gen XII EA V2.5 that leverages machine learning for pattern prediction and high-frequency trading on MT4.