
HTF Volume Liquidity Profile [AlgoAlpha]
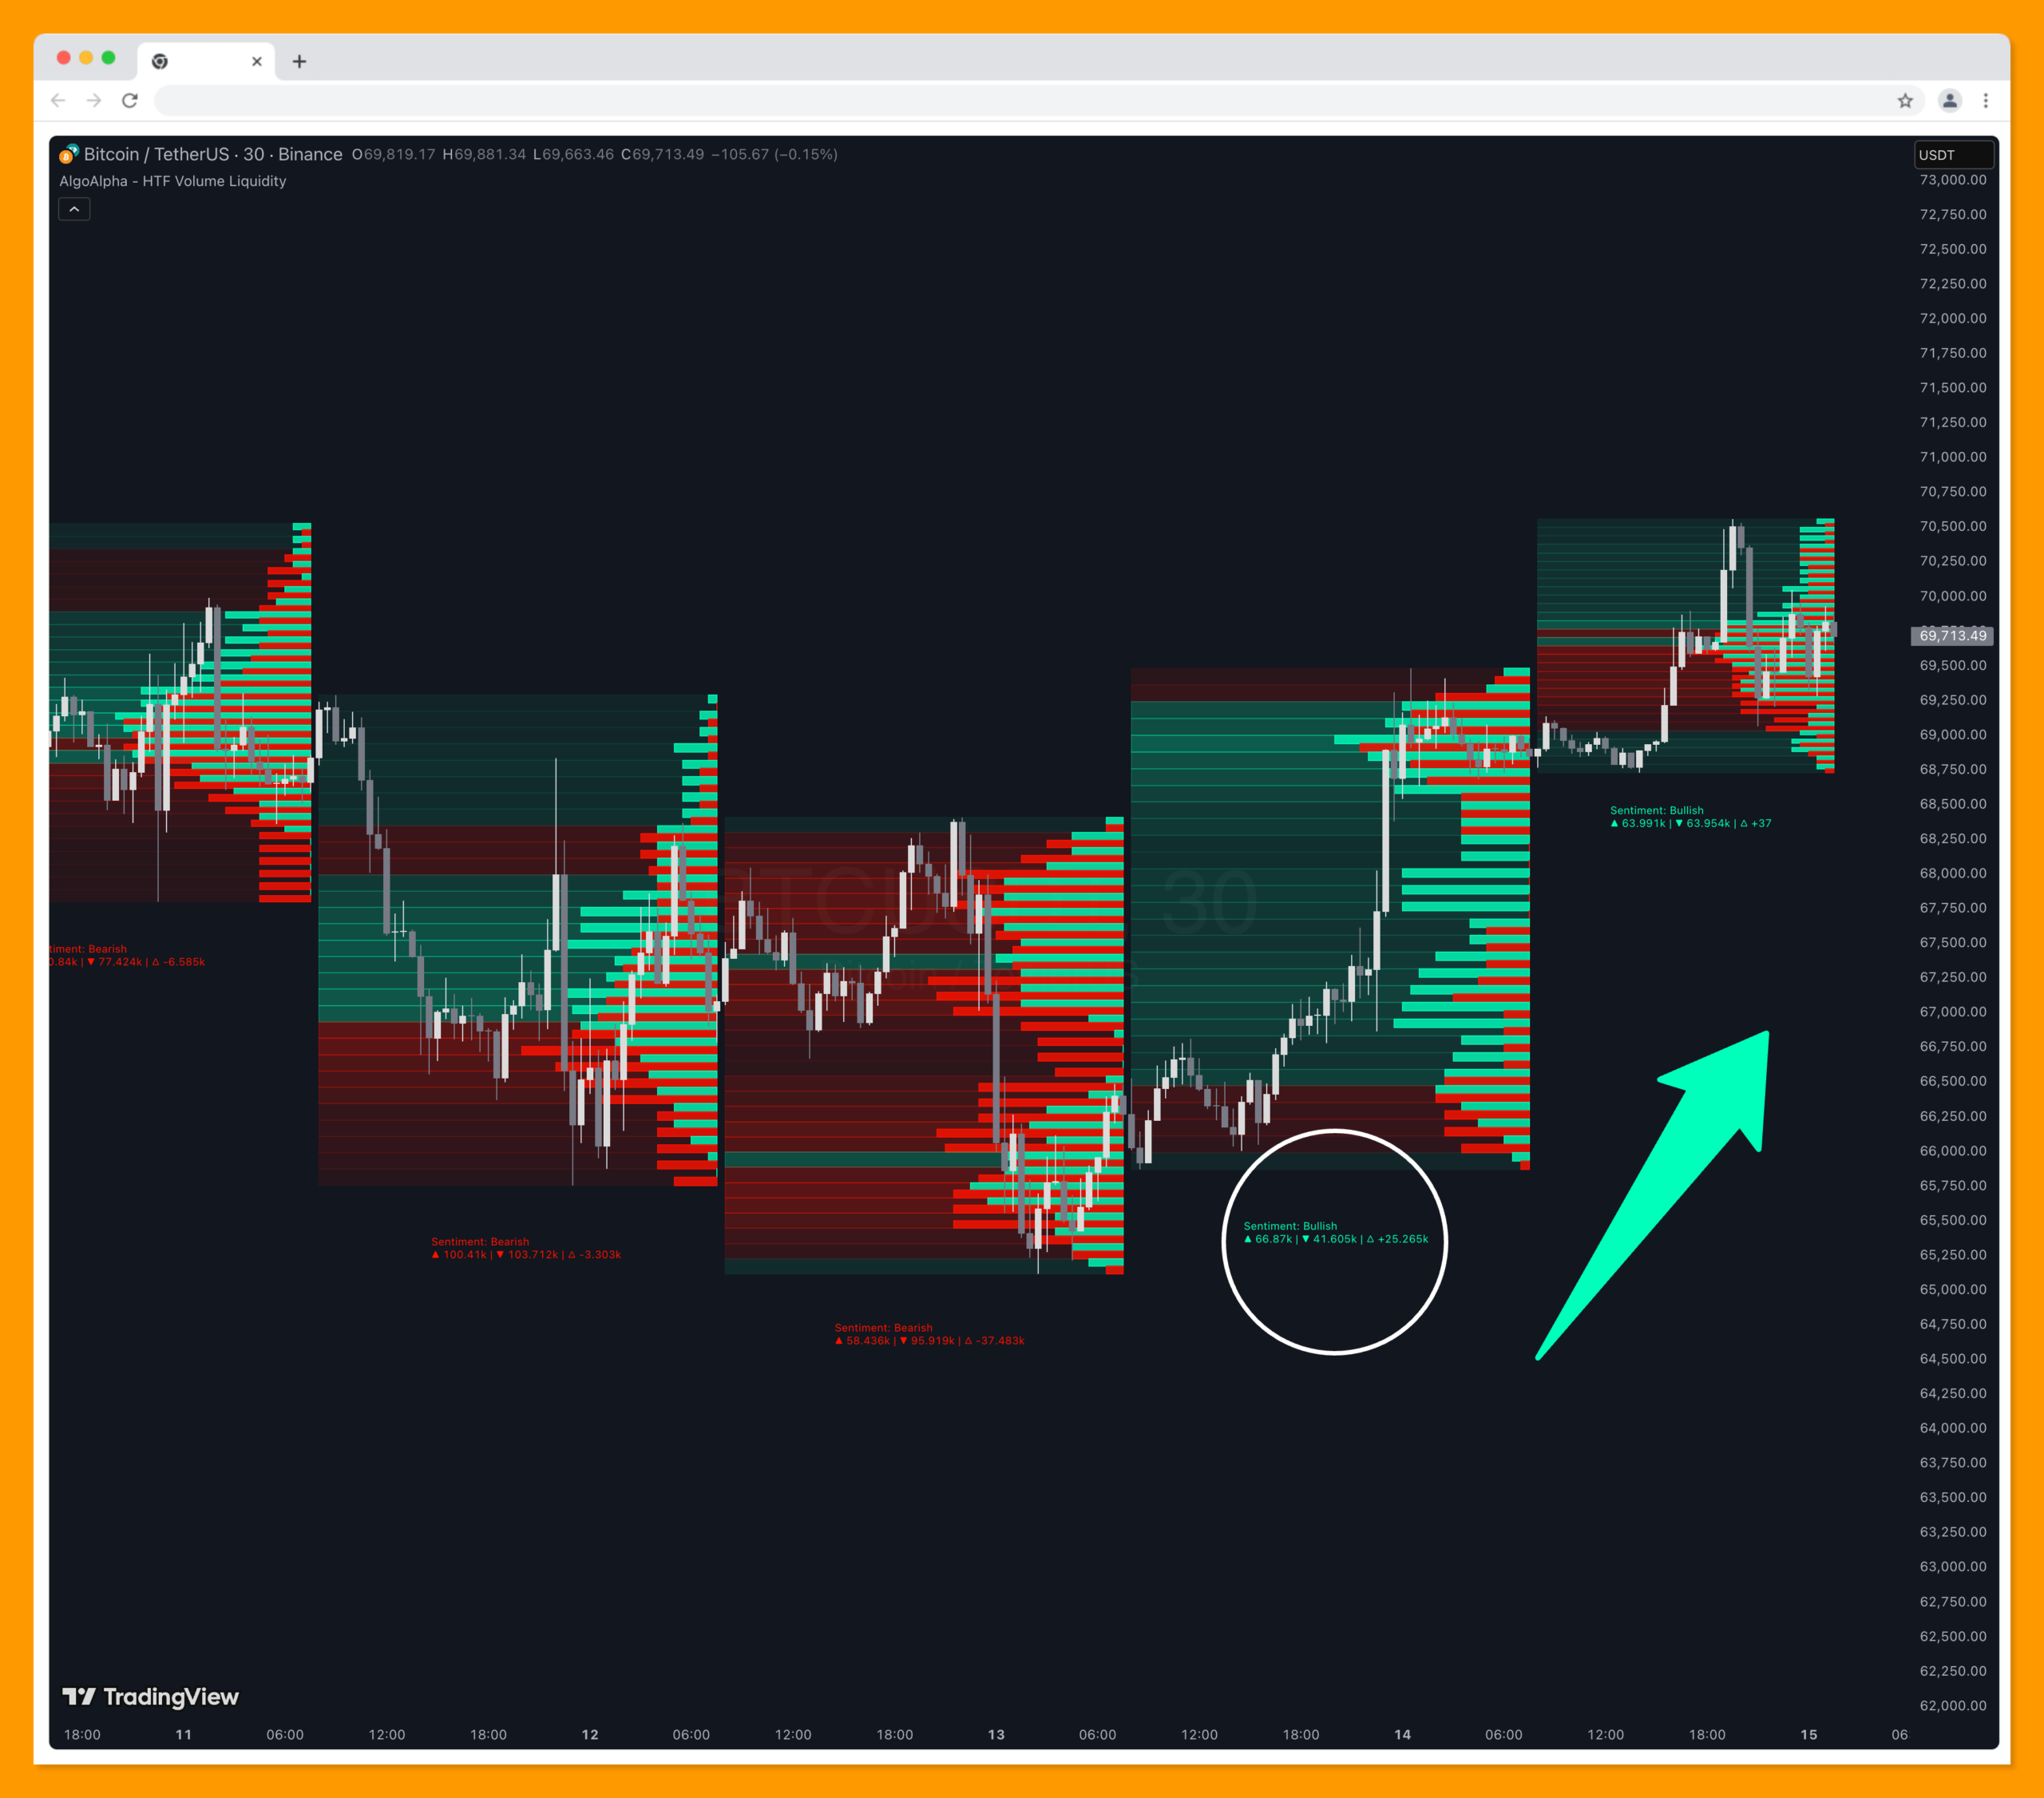
This tool projects a volume profile from a higher timeframe directly onto your current chart. By breaking down historical price action into vertical intervals, it creates a heatmap of where volume was concentrated during that larger period
🟠OVERVIEW
This tool projects a volume profile from a higher timeframe directly onto your current chart. By breaking down historical price action into vertical intervals, it creates a heatmap of where volume was concentrated during that larger period. It maps out areas of high liquidity, showing exactly where buyers and sellers were most active, and displays a detailed breakdown of bullish versus bearish volume at specific price levels within that higher timeframe block.
🟠CONCEPTS
This script takes that concept and applies it to a higher timeframe, meaning you can look at a 5-minute chart and see the volume distribution for the entire day overlaid as a single block. It calculates the highest and lowest prices of the chosen timeframe and divides that range into smaller segments based on your resolution setting. It then tallies the volume of every lower timeframe candle that falls into each segment. It also splits this volume into positive and negative flows based on whether the individual candles closed green or red. This gives you a clear picture of net directional pressure at each price level, acting like a lightweight footprint chart.
🟠FEATURES
- Higher timeframe volume heatmap overlaid directly on the current lower timeframe chart.
- Inner mini-boxes showing the exact proportion of bullish (green) vs bearish (red) volume at each specific price level.
- Summary label displaying total up volume, down volume, volume delta, and overall sentiment for the entire interval.
🟠USAGE
- Setup: Add the script to your chart. Choose a higher timeframe that makes sense for your trading style (for example, use 1D if you are trading on a 5-minute or 15-minute chart). Adjust the resolution depending on how granular you want the price levels to be.
- Read the chart: Darker, more opaque background boxes mean a high amount of total volume was traded at that price level (High Volume Nodes). The inner mini-boxes show the tug-of-war at that level; a longer green inner box means buyers dominated that specific price, while a longer red one means sellers dominated. The label at the bottom of each block summarizes the total volume delta so you instantly know who won the overall period.
- Settings that matter: The Higher TimeFrame input dictates the width and duration of each volume profile block. The Profile Resolution input controls how many vertical slices the price range is divided into; increasing this adds finer detail but can visually clutter the chart if set too high
Related Products
100% This Pine Script™ code is subject
The Apex Trend & Liquidity Master is a hybrid trading system designed to align traders with the dominant market trend while identifying key structural price levels. Unlike simple moving average crossovers or standalone support/resistance tools, this script integrates a volatility-adaptive "Trend Cloud" with a "Smart Liquidity" engine.
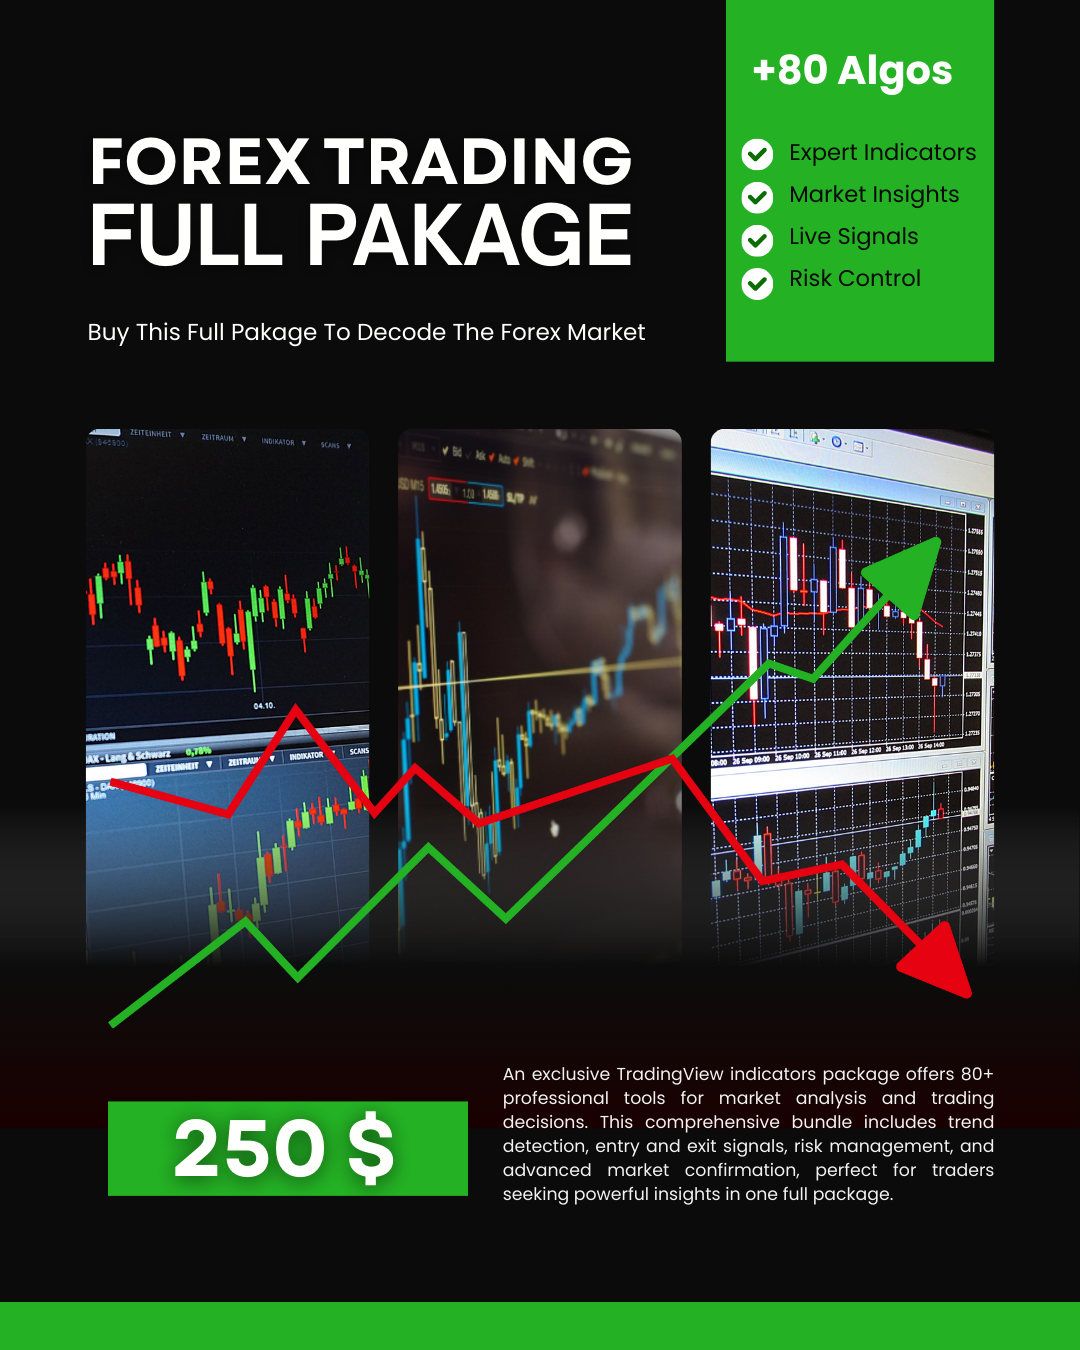
80+ Pro TradingView Indicators Bundle – Trade Smarter with One Powerful System
An exclusive TradingView indicators package featuring 80+ professional tools designed for precise market analysis and smarter trading decisions. This all-in-one bundle covers trend detection, entry and exit signals, risk management, and advanced market confirmation—ideal for traders who want powerful insights in one premium package.
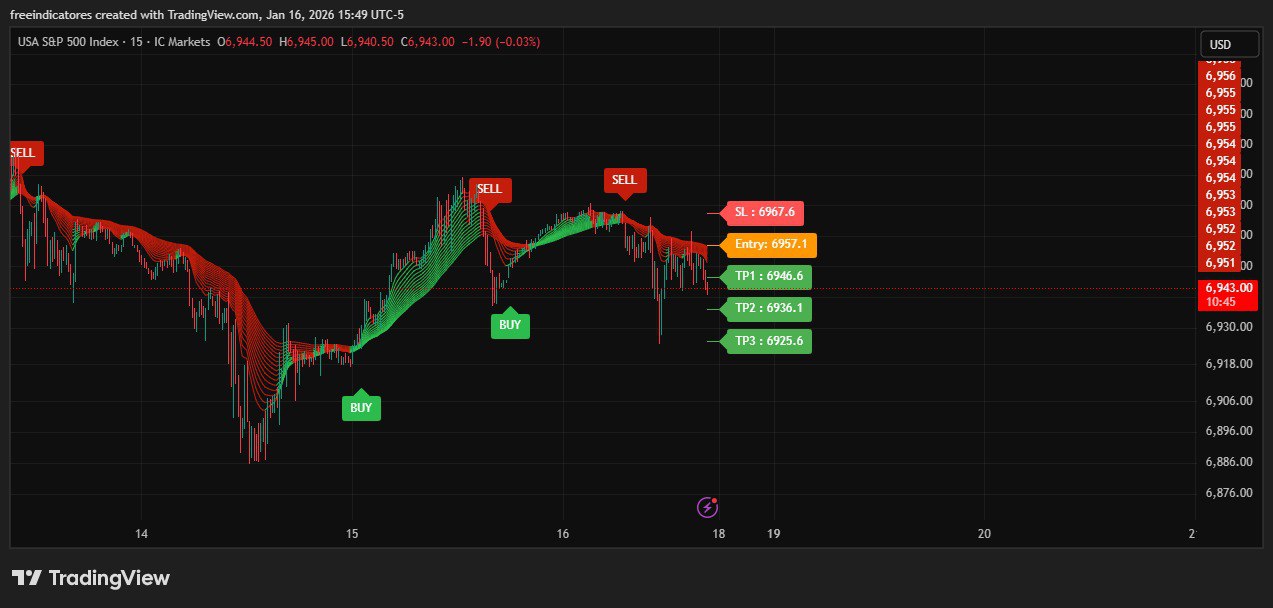
AI Signals Remastered
Signal Generation: Uses EMA clusters and a modified Supertrend (Keltner-based) to identify trends
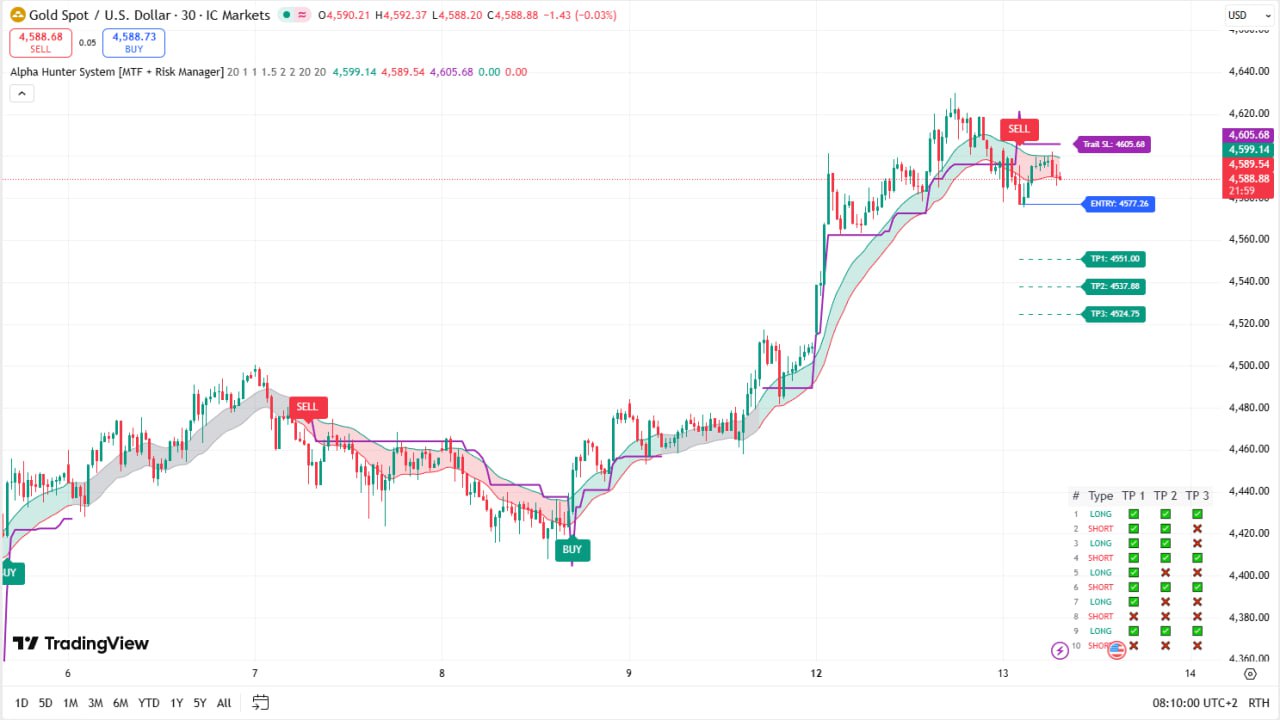
Alpha Hunter System (MTF + Risk Manager) – Full Explanation
Alpha Hunter System is a comprehensive TradingView indicator designed to combine trend detection, multi-filter confirmation, and advanced risk management into a single trading system. It is suitable for Forex, Crypto, Indices, and Stocks, and works across multiple timeframes.
![Arbitrage Detector [LuxAlgo] Download Free](https://digitaltradehub.net/wp-content/uploads/2026/01/g6Uhg3kr.png)
Arbitrage Detector [LuxAlgo] Download Free
The Arbitrage Detector unveils hidden spreads in the crypto and forex markets. It compares the same asset on the main crypto exchanges and forex brokers and displays both prices and volumes on a dashboard, as well as the maximum spread detected on a histogram divided by four user-selected percentiles.
![Arbitrage Matrix [LuxAlgo]](https://digitaltradehub.net/wp-content/uploads/2026/02/Arbitrage-Matrix-LuxAlgo.png)
Arbitrage Matrix [LuxAlgo]
The Arbitrage Matrix is a follow-up to our Arbitrage Detector that compares the spreads in price and volume between all the major crypto exchanges and forex brokers for any given asset.