
Hyper-Spectral Neural Flow Foe tradingview - PineScript - Free Download
Transform your chart analysis with a cutting-edge indicator that combines machine learning-inspired smoothing algorithms with stunning visual feedback systems for precise trend identification and market momentum visualization.
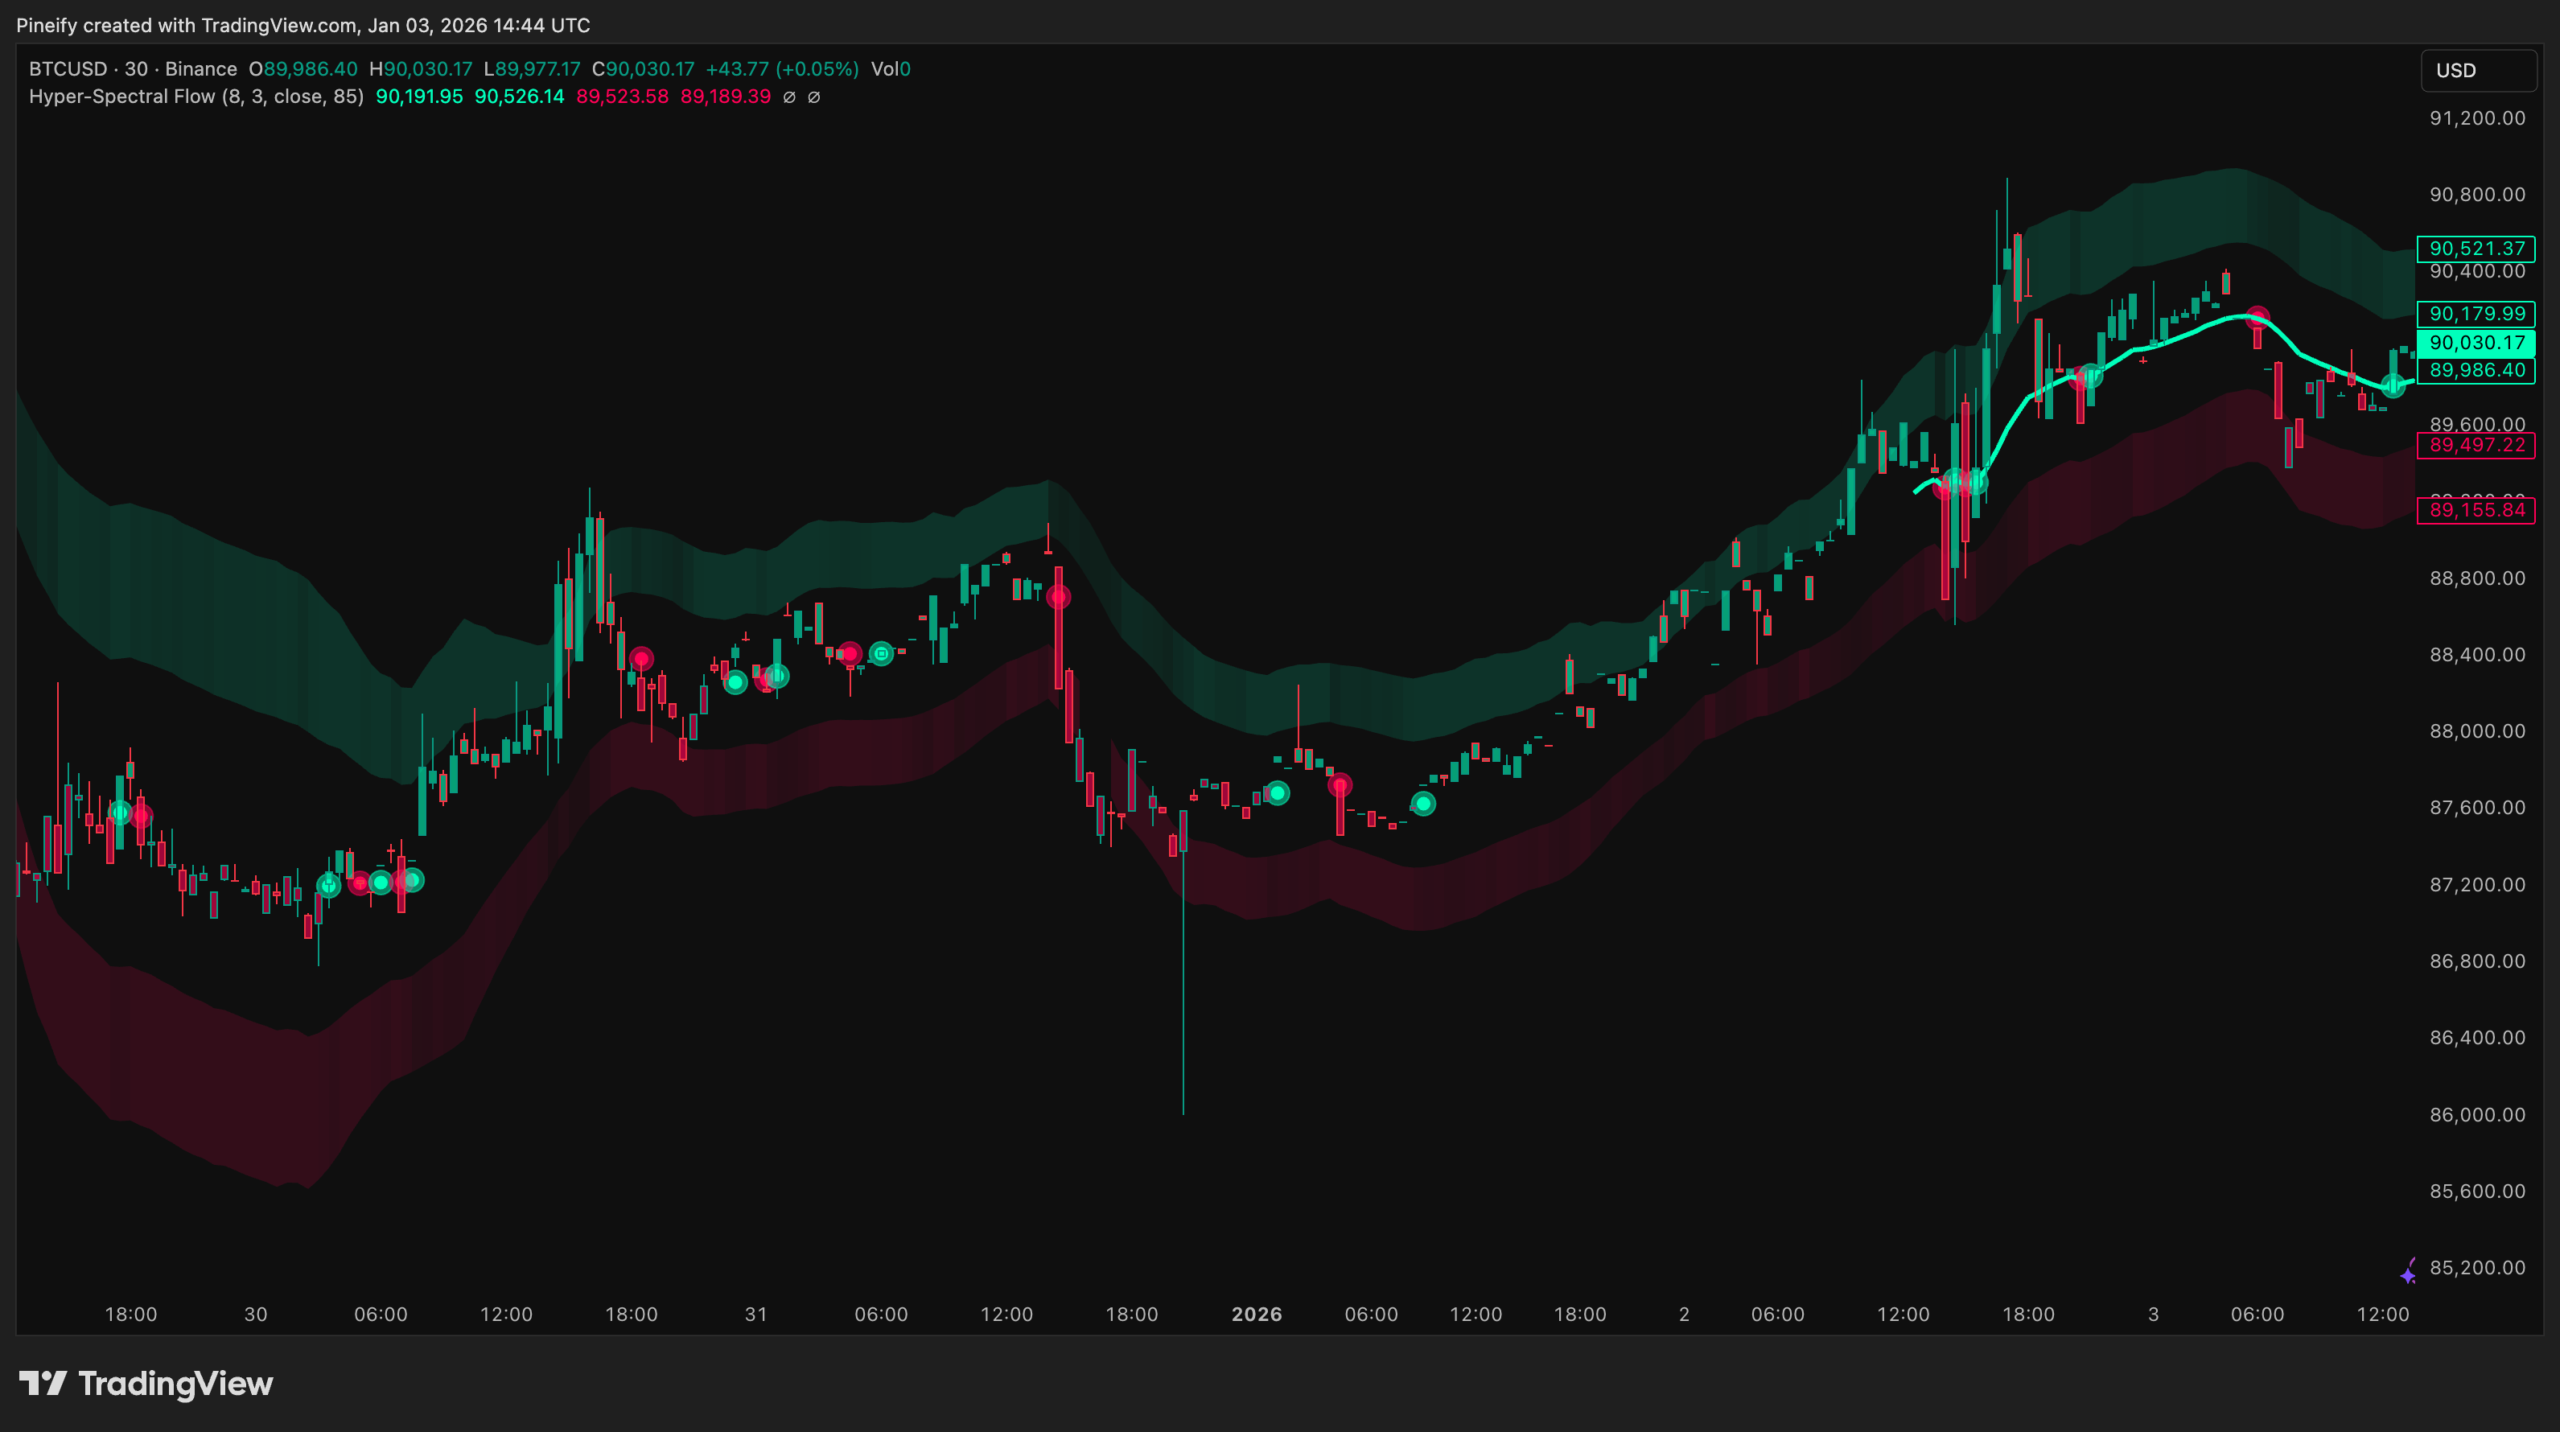
The Hyper-Spectral Neural Flow is a sophisticated technical analysis tool that implements Gaussian Kernel Regression smoothing to estimate the underlying price trend with minimal lag while providing dynamic volatility-based visual feedback through its signature “spectral aura” display. Unlike conventional moving averages or simple trend indicators, this tool adapts its smoothing characteristics based on localized price behavior, creating a neural-inspired pathway that represents the market’s true trend direction.
The indicator’s core calculation utilizes a 50-bar Gaussian window with customizable bandwidth parameters, allowing traders to balance between responsiveness and smoothness according to their trading style. Surrounding this core trend line are multi-layered spectral bands that expand and contract based on market volatility, measured through a combination of Mean Absolute Error (MAE) and user-defined multipliers.
snapshot
Key Features
Gaussian Kernel Neural Core – A proprietary smoothing algorithm that calculates localized weighted averages using Gaussian distribution weights, providing superior noise reduction compared to traditional moving averages
Multi-Layered Spectral Aura – Four distinct volatility bands (inner/upper and inner/lower) that create a dynamic visual representation of market volatility and trend strength
Adaptive Gradient Fills – Color-gradient transparency that adjusts based on price position relative to the neural core, creating an energy field effect that visually communicates market momentum
Trend Pulse Markers – Automatic circular markers that appear precisely when the neural flow shifts direction, providing clear entry/exit signals
Dynamic Bar Coloring – Price bars that change color and transparency based on trend direction, enhancing visual pattern recognition
Real-Time Trend Calculation – Optimized 50-bar rolling window ensures responsive performance without excessive computational load
Customizable Alert System – Built-in alert conditions for neural flow direction changes
How It Works
The indicator’s calculation engine operates on three distinct levels working in harmony:
Neural Core Calculation – For each bar, the algorithm computes a weighted average of the previous 50 bars using Gaussian kernel functions. The weight assigned to each historical bar follows a bell curve distribution, where more recent bars receive exponentially higher weights. The mathematical formula is: weight = exp(-(distance²) / (2 × bandwidth²)), where the bandwidth parameter (default: 8.0) controls the smoothness sensitivity.
Volatility Band Derivation – The spectral bands are calculated using the Mean Absolute Error (MAE) between price and the neural core, smoothed over 50 periods and multiplied by a user-defined spectral range multiplier (default: 3.0). This creates four bands: outer upper (+1.0× MAE), inner upper (+0.5× MAE), inner lower (-0.5× MAE), and outer lower (-1.0× MAE).
Trend Direction Logic – The system determines trend direction by comparing the current neural core value to the previous bar’s value. When the core rises, the bullish flow color activates; when it declines, the bearish flow color engages.
Trading Ideas and Insights
Trend Following – Use the neural core as your primary trend reference. When price is above the core with the bullish flow color active, look for long entry opportunities on pullbacks to the inner lower spectral band
Trend Reversal Detection – Watch for the trend pulse markers combined with price crossing the neural core. A bullish pulse appearing after a bearish phase, especially near the outer lower band, often signals a trend reversal
Volatility Contraction Plays – When the spectral bands narrow significantly (indicating low volatility), prepare for potential breakout trades as volatility expansion often follows consolidation periods
Support/Resistance Zones – The inner and outer spectral bands often act as dynamic support and resistance levels. Price rejection from these bands, combined with trend pulse markers, provides high-probability trade setups
Momentum Assessment – Strong trends show the spectral bands expanding in the direction of the move while maintaining consistent separation. Converging bands suggest momentum weakening
How Multiple Indicators Work Together
The true power of Hyper-Spectral Neural Flow lies in the synergistic integration of its components:
The Gaussian Kernel Core provides the foundational trend direction, eliminating noise while preserving genuine price movements
The Spectral Bands add context by showing volatility-adjusted price boundaries, preventing premature entries during low-volatility conditions
The Gradient Fill System offers immediate visual feedback about trend strength—wider, more opaque bands indicate stronger trends, while narrow, transparent bands suggest weakness
The Trend Pulse Markers serve as confirmation signals, ensuring traders don’t act on minor core fluctuations but only on meaningful directional changes
This multi-component approach means each element validates the others: a trend pulse marker appearing while price is at an outer band and the spectral aura is expanding provides three independent confirmations of a significant trading opportunity.
Unique Aspects
Machine Learning Foundation – Unlike most TradingView indicators based on standard technical analysis formulas, this implements concepts from Gaussian Process Regression, a technique used in advanced machine learning applications
Visual Hierarchy – The layered design (core line → inner bands → outer bands) creates a natural visual priority system that guides the eye from the most important element (trend direction) to secondary context (volatility levels)
Adaptive Smoothing – The Gaussian bandwidth parameter allows traders to morph the indicator between a short-term scalping tool (lower values) and a long-term trend following system (higher values) without changing the underlying algorithm
Neuro-Aesthetic Design – The visual language mimics neural network imagery and spectrographic displays, making complex data intuitively understandable through association with familiar scientific visualization
How to Use
Add the indicator to your chart from the indicators library and overlay it on your price data
Begin with default settings (Neural Bandwidth: 8.0, Spectral Range: 3.0) to observe the indicator’s behavior on your timeframe
For trend following: Only take long trades when the neural core is rising and showing the bullish flow color; only take short trades when the core is declining with bearish flow color
For entry timing: Use the inner spectral bands as pullback entry zones during strong trends—the inner lower band for longs, the inner upper band for shorts
For stop placement: Consider placing stops just beyond the outer spectral band opposite your trade direction
For trend confirmation: Wait for trend pulse markers to appear before entering positions, especially when trading counter-trend reversals
For exit signals: Consider partial profits when price reaches the outer band in the direction of your trade, or when a trend pulse marker signals a potential direction change
Customization
Neural Bandwidth (1.0 to 20.0) – Increase for smoother, slower signals suitable for swing trading (try 12.0-15.0 on daily charts); decrease for more responsive signals for scalping or day trading (try 3.0-5.0 on intraday timeframes)
Spectral Range (0.5 to 10.0) – Higher values widen the volatility bands, resulting in fewer signals but potentially larger winning trades; lower values create tighter bands for more frequent signals but increased false signals during volatility spikes
Bullish/Bearish Flow Colors – Customize to match your chart aesthetic or preference; consider using colors that contrast well with your background for optimal visibility
Aura Opacity (0 to 100) – Adjust to control the prominence of the spectral gradient fills; lower values make the chart less cluttered, higher values emphasize the volatility expansion/contraction cycles
Trend Pulse Marks – Disable if you prefer a cleaner visual and plan to rely solely on core direction and band relationships for signals
Conclusion
The Hyper-Spectral Neural Flow represents a paradigm shift in trend indicator design, bridging the gap between rigorous statistical methodology and intuitive visual communication. By implementing Gaussian kernel regression—typically found in advanced machine learning applications—within an accessible TradingView indicator, it offers traders a professional-grade trend detection tool that doesn’t sacrifice usability for sophistication.
Whether you’re a systematic trader who relies on objective, rule-based signals, a discretionary trader who values contextual market information, or a quantitative analyst seeking robust trend estimation, this indicator provides the flexibility to adapt to your methodology while maintaining mathematical rigor in its core calculations.
The integration of volatility-based spectral bands with the neural core creates a complete trading framework in a single indicator: trend identification, volatility assessment, entry timing guidance, and trend change signals—all unified through a cohesive visual language that makes complex data immediately actionable. By understanding how the Gaussian smoothing adapts to market conditions and how the spectral bands breathe with volatility, traders gain deeper insight into market structure beyond simple price movement.
Add the Hyper-Spectral Neural Flow to your chart analysis toolkit and experience the difference that machine learning-inspired indicators can make in your trading decisions.
Open-source script
In true TradingView spirit, the creator of this script has made it open-source, so that traders can review and verify its functionality. Kudos to the author! While you can use it for free, remember that republishing the code is subject to our House Rules.
Pineify
Follow
🚀🚀🚀 Pineify – pineify.app
Essential Toolkit for Every Trader
– AI Pine Script Generator
– Pine Script Visual Editor
– DIY Custom Strategy Builder
– Pine Screener Generator
– Invited indicators
– Strategy Optimizer
– Trading Journal
Also on:
Disclaimer
The information and publications are not meant to be, and do not constitute, financial, investment, trading, or other types of advice or recommendations supplied or endorsed by TradingView. Read more in the Terms of Use.
Related Products
100% This Pine Script™ code is subject
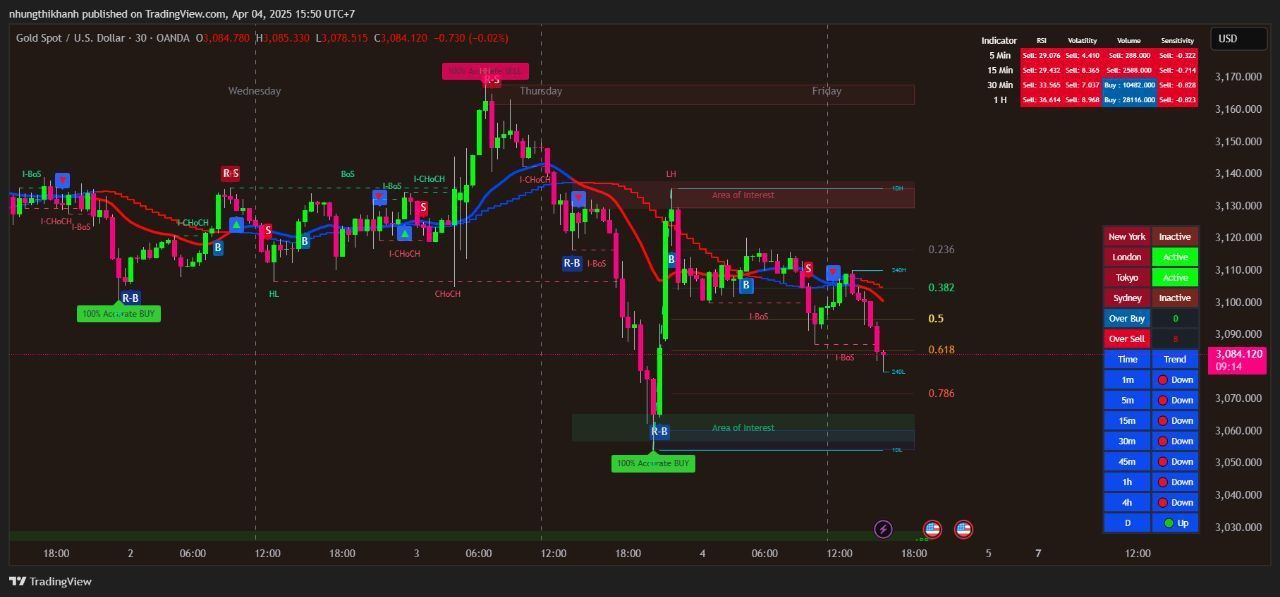
The Apex Trend & Liquidity Master is a hybrid trading system designed to align traders with the dominant market trend while identifying key structural price levels. Unlike simple moving average crossovers or standalone support/resistance tools, this script integrates a volatility-adaptive "Trend Cloud" with a "Smart Liquidity" engine.
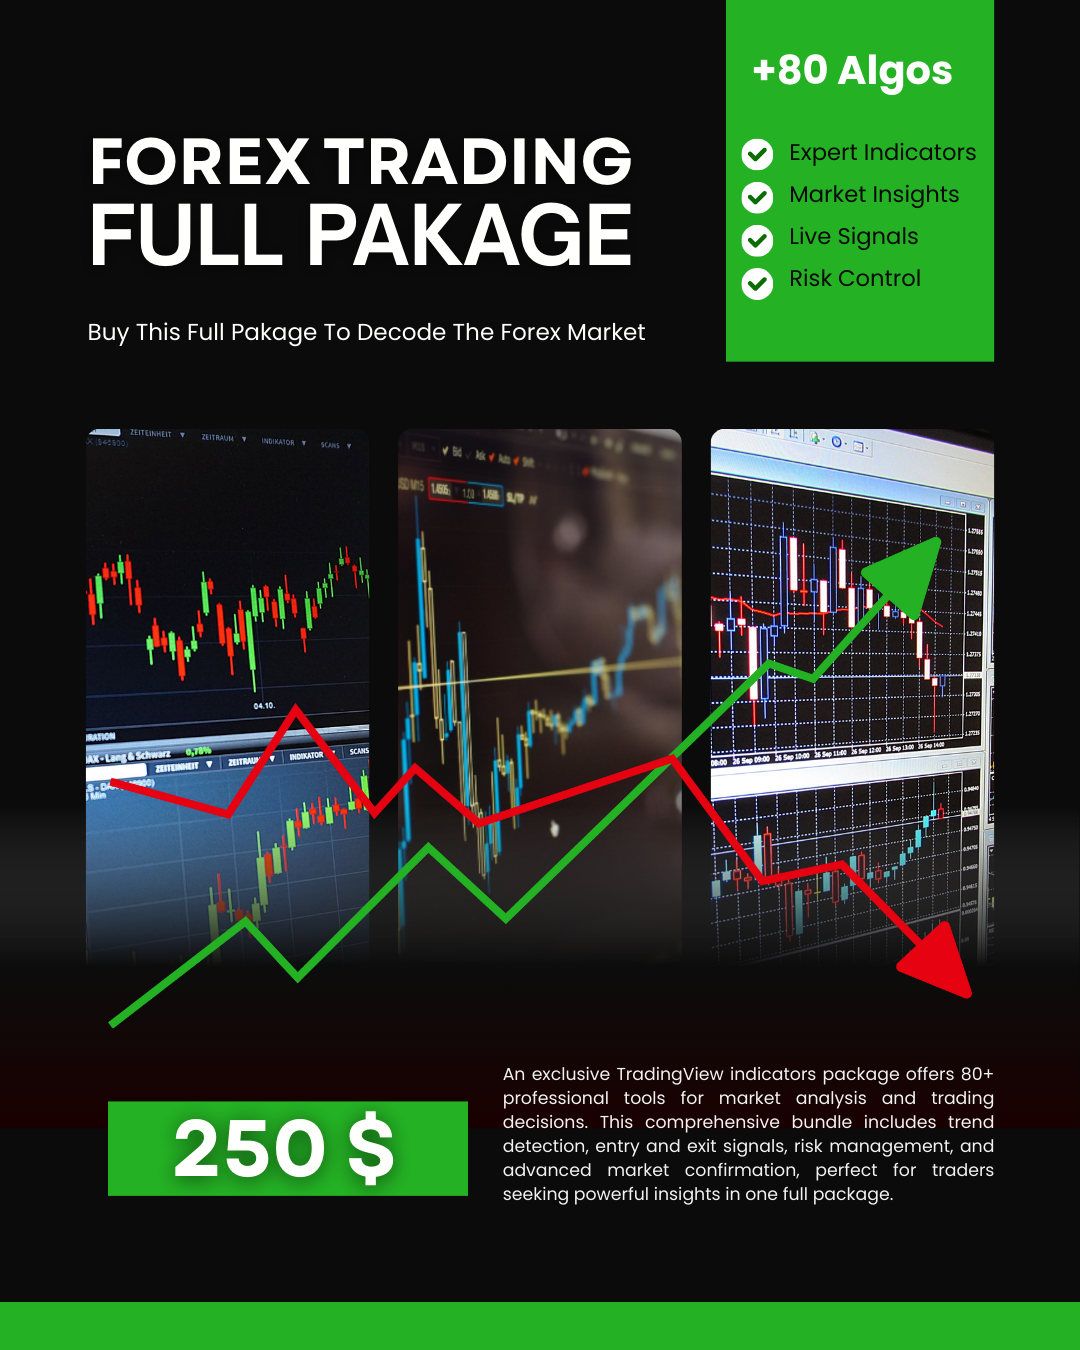
80+ Pro TradingView Indicators Bundle – Trade Smarter with One Powerful System
An exclusive TradingView indicators package featuring 80+ professional tools designed for precise market analysis and smarter trading decisions. This all-in-one bundle covers trend detection, entry and exit signals, risk management, and advanced market confirmation—ideal for traders who want powerful insights in one premium package.
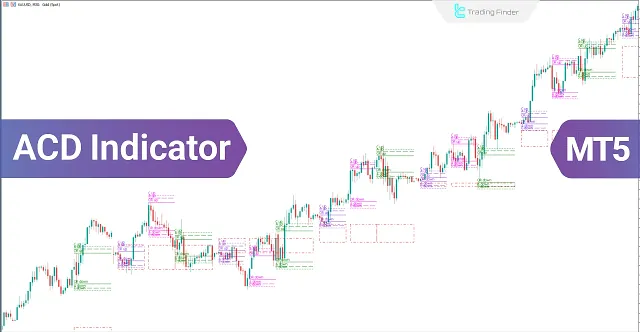
ACD Indicator for MetaTrader 5 Download - Free
The ACD indicator is a technical analysis tool in MetaTrader 5 developed by Mark Fisher and can also be used as a trading strategy. This tool is highly suitable for detecting daily price trends.
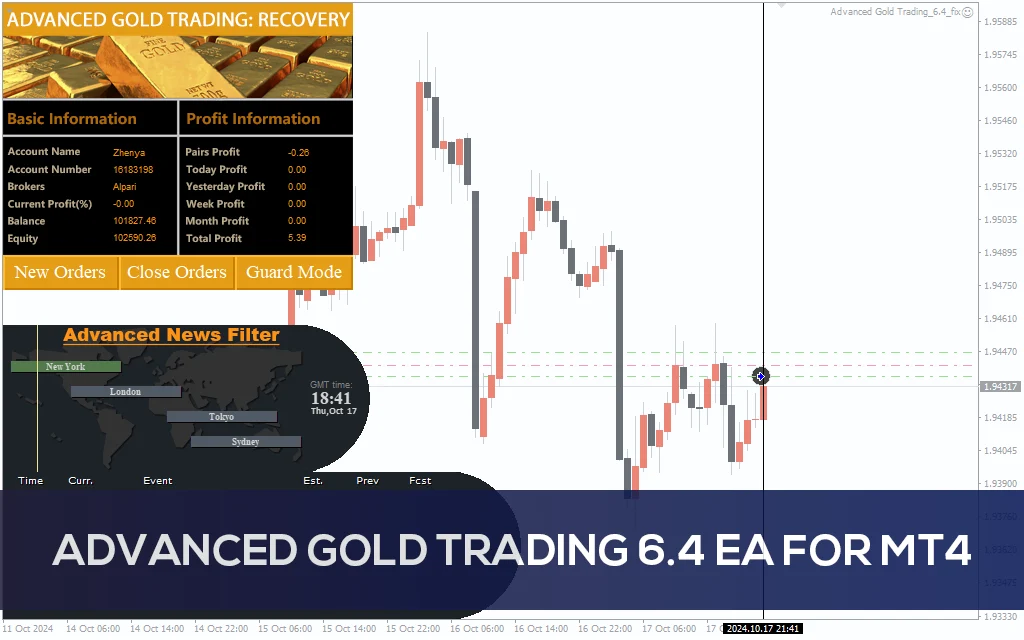
Advanced Gold Trading V6.4 EA MT4
Advanced Gold Trading V6.4 EA MT4 CATEGORY: MT4 EXPERTS
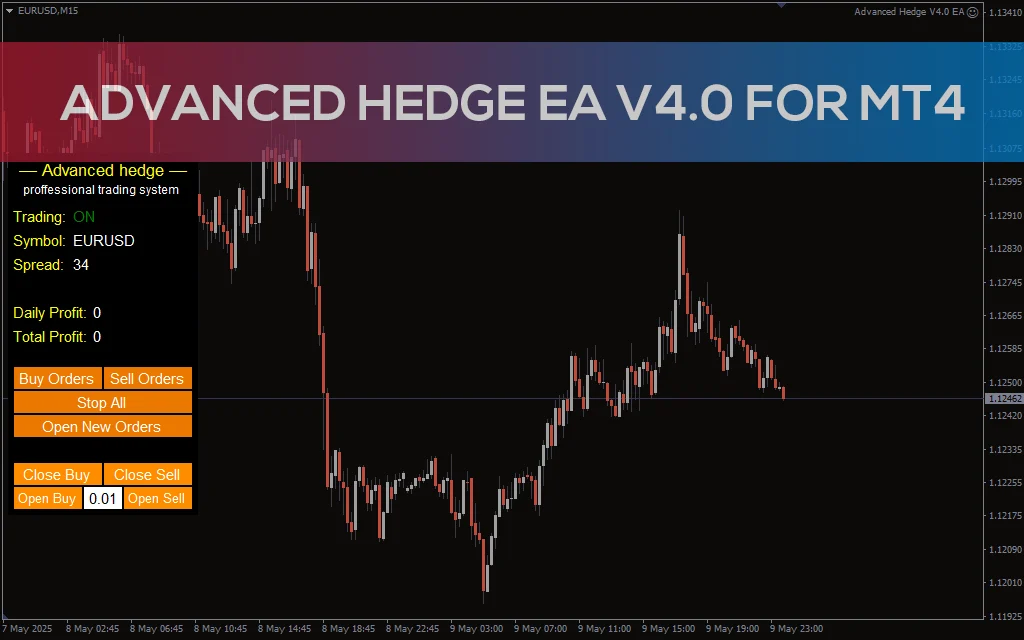
Advanced Hedge EA V4.0 MT4
Discover the Advanced Hedge EA V4.0 for MT4. This powerful automated trading tool helps users manage multiple hedged positions while optimizing profits and minimizing risks. Perfect for Forex traders who seek a reliable and sophisticated hedging strategy. CATEGORY: MT4 EXPERTS
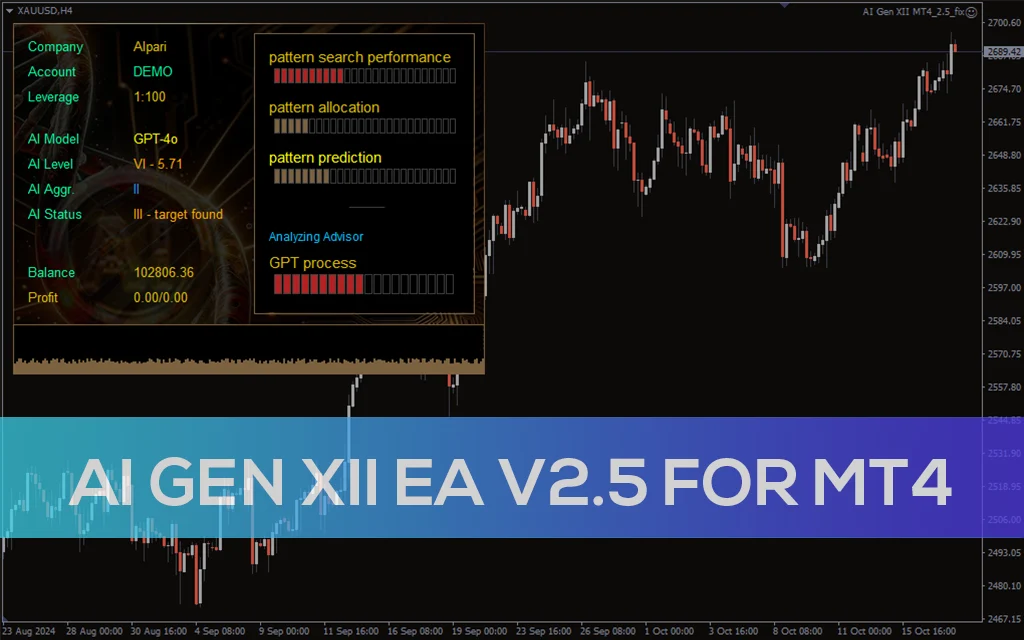
AI Gen XII EA V2.5 MT4
A sophisticated AI-driven AI Gen XII EA V2.5 that leverages machine learning for pattern prediction and high-frequency trading on MT4.