
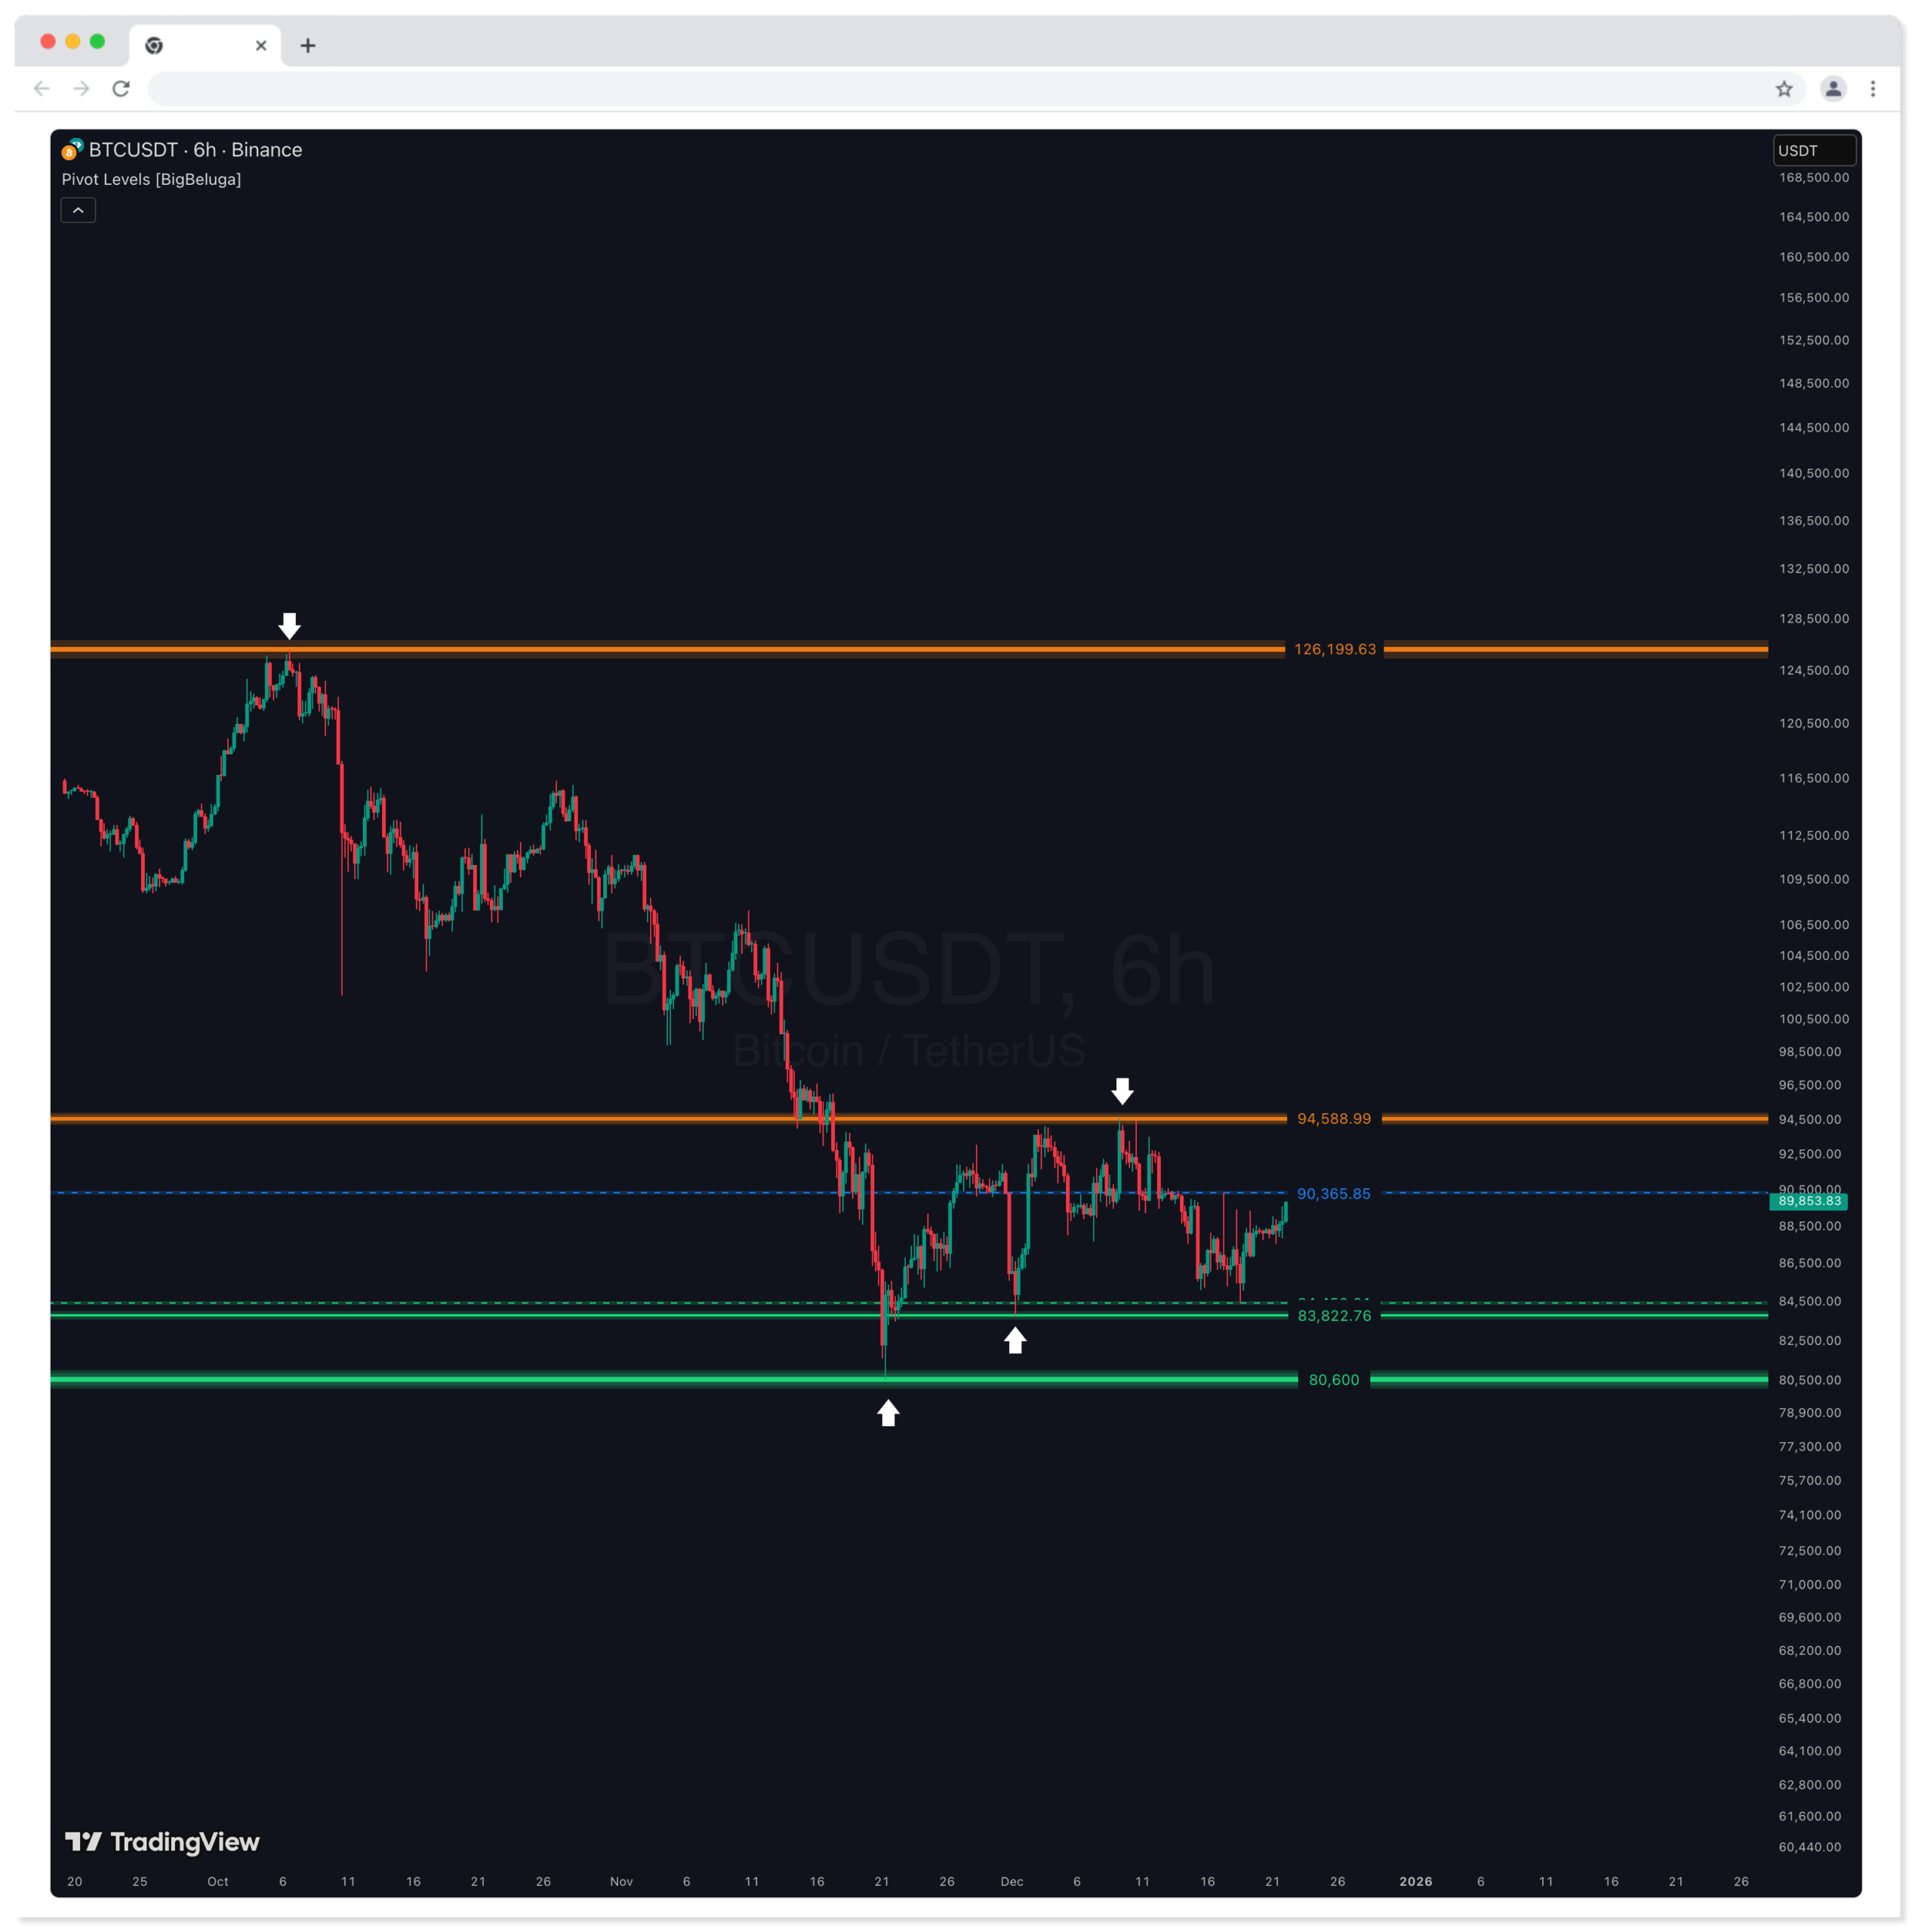
Pivot Levels [BigBeluga]
The Pivot Levels [BigBeluga] indicator automatically detects and draws key market pivot levels across multiple sensitivity settings. Each pivot level represents a significant local high or low in price structure, acting as potential zones of support and resistance.
The Pivot Levels [BigBeluga] indicator automatically detects and draws key market pivot levels across multiple sensitivity settings. Each pivot level represents a significant local high or low in price structure, acting as potential zones of support and resistance. Traders can visualize short-, medium-, and long-term pivot layers simultaneously, helping to identify where price may react, reverse, or break out.
🔵 CONCEPTS
- Different pivot lengths provide multi-length sensitivity on the same timeframe — shorter lengths detect local micro-swings, while longer lengths capture broader swing structure within the current chart.
- ATR-based color logic marks active, bullish, or bearish pivot zones dynamically.
- Lines can extend to the right or both sides to track reactions over time.
🔵 FEATURES
- Detects up to four custom pivot levels simultaneously.
- Each pivot level has independent settings for length, style, and extension mode.
- Auto-colors each pivot as support (green), resistance (orange), or active zone (blue).
- Displays dual-width line layers: a solid base and a transparent overlay for visual depth.
- Dynamic price labels show exact pivot levels for clarity.
- Fully customizable line styles: dashed (–), solid (-), or dotted (..).
- Extends lines to the right for future reaction tracking or both directions for structure alignment.
🔵 HOW TO USE
- Enable or disable pivot levels (1–4) to control how many layers of structure you want visible.
- Use shorter pivot lengths for intraday turning points and longer ones for macro structure.
- Watch for multiple pivot lines clustering in the same region — these often mark strong reversal zones.
- Observe color changes: green = support, orange = resistance, blue = active neutral zone.
- Combine with price action or volume analysis to confirm reactions near major pivots.
🔵 CONCLUSION
The Pivot Levels [BigBeluga] indicator provides a clean, multi-layered visualization of market structure.
By tracking pivots of varying lengths, traders can easily identify overlapping support and resistance regions, gauge breakout strength, and align trades with the dominant structural zones visible across multiple time horizons.
Update
- Added volume value displayed directly on each level
- Added volume distribution (%) to show relative importance of each zone
- Makes it easier to identify high-participation levels and prioritize key liquidity areas
Related Products
100% This Pine Script™ code is subject
The Apex Trend & Liquidity Master is a hybrid trading system designed to align traders with the dominant market trend while identifying key structural price levels. Unlike simple moving average crossovers or standalone support/resistance tools, this script integrates a volatility-adaptive "Trend Cloud" with a "Smart Liquidity" engine.
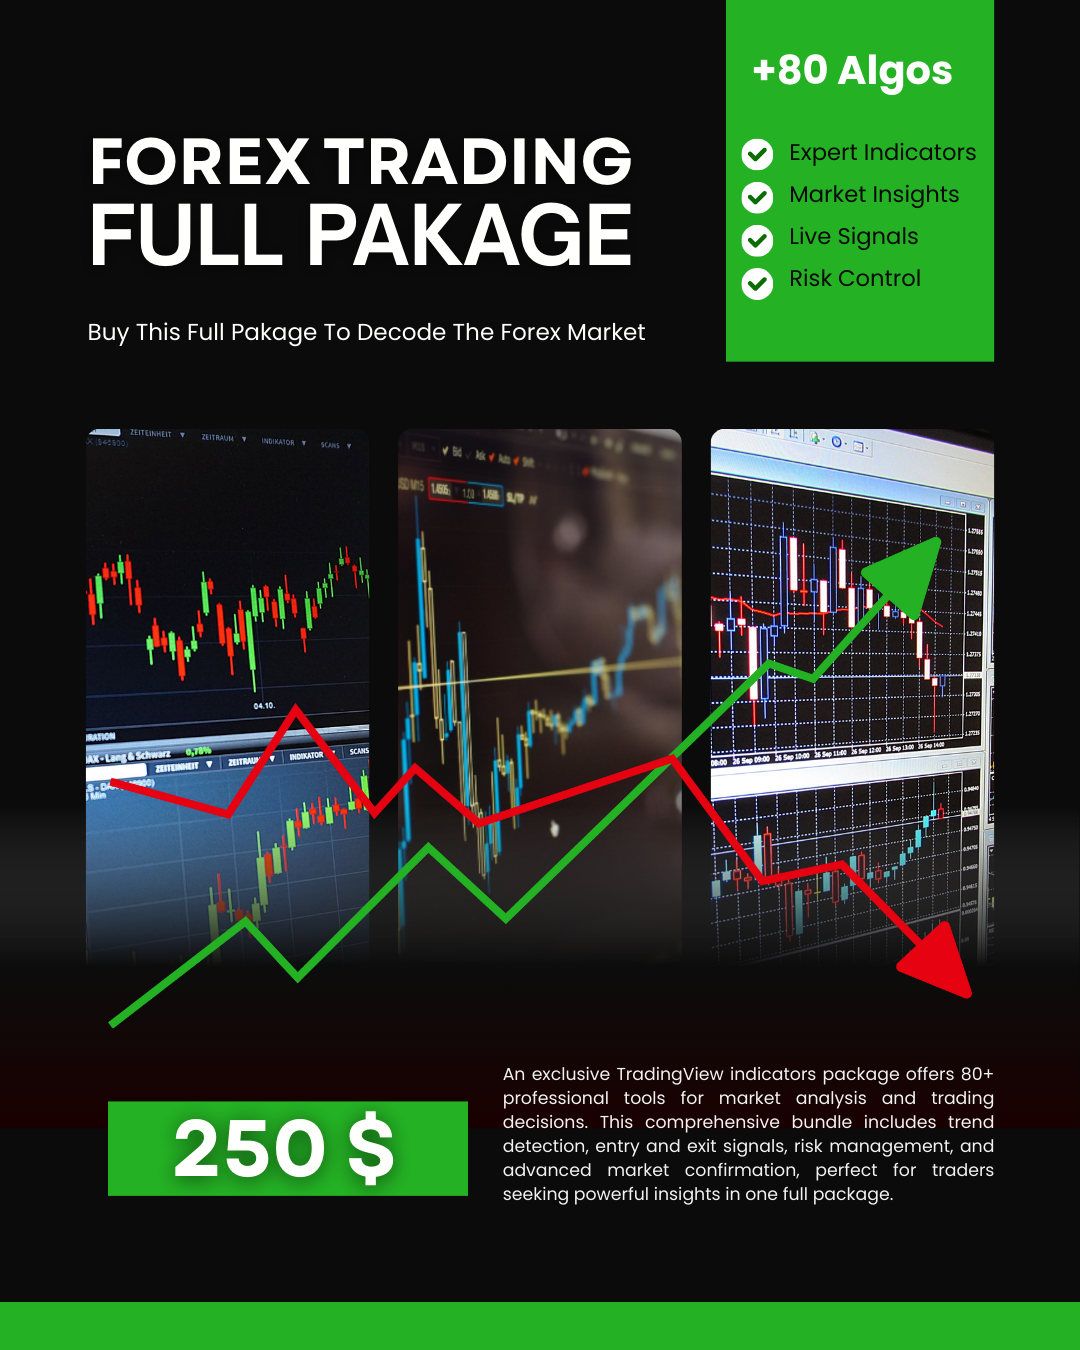
80+ Pro TradingView Indicators Bundle – Trade Smarter with One Powerful System
An exclusive TradingView indicators package featuring 80+ professional tools designed for precise market analysis and smarter trading decisions. This all-in-one bundle covers trend detection, entry and exit signals, risk management, and advanced market confirmation—ideal for traders who want powerful insights in one premium package.
AI Signals Remastered
Signal Generation: Uses EMA clusters and a modified Supertrend (Keltner-based) to identify trends
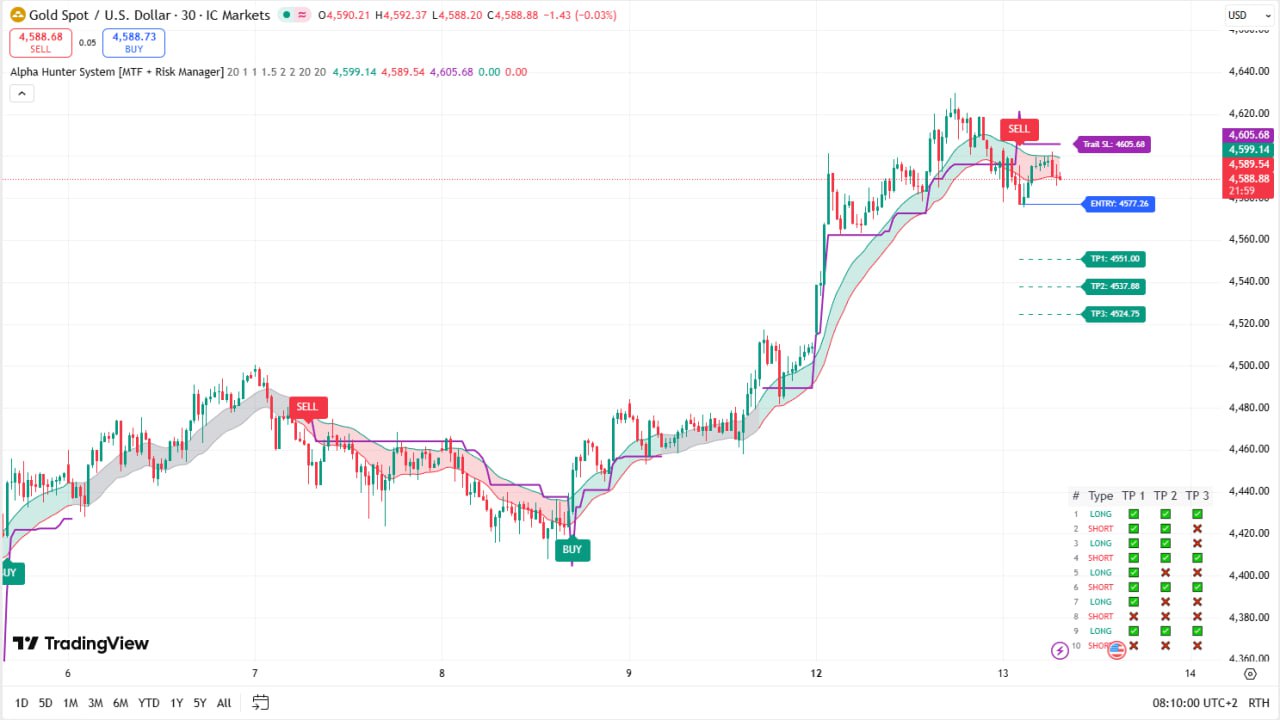
Alpha Hunter System (MTF + Risk Manager) – Full Explanation
Alpha Hunter System is a comprehensive TradingView indicator designed to combine trend detection, multi-filter confirmation, and advanced risk management into a single trading system. It is suitable for Forex, Crypto, Indices, and Stocks, and works across multiple timeframes.
![Arbitrage Detector [LuxAlgo] Download Free](https://digitaltradehub.net/wp-content/uploads/2026/01/g6Uhg3kr.png)
Arbitrage Detector [LuxAlgo] Download Free
The Arbitrage Detector unveils hidden spreads in the crypto and forex markets. It compares the same asset on the main crypto exchanges and forex brokers and displays both prices and volumes on a dashboard, as well as the maximum spread detected on a histogram divided by four user-selected percentiles.
![Arbitrage Matrix [LuxAlgo]](https://digitaltradehub.net/wp-content/uploads/2026/02/Arbitrage-Matrix-LuxAlgo.png)
Arbitrage Matrix [LuxAlgo]
The Arbitrage Matrix is a follow-up to our Arbitrage Detector that compares the spreads in price and volume between all the major crypto exchanges and forex brokers for any given asset.