
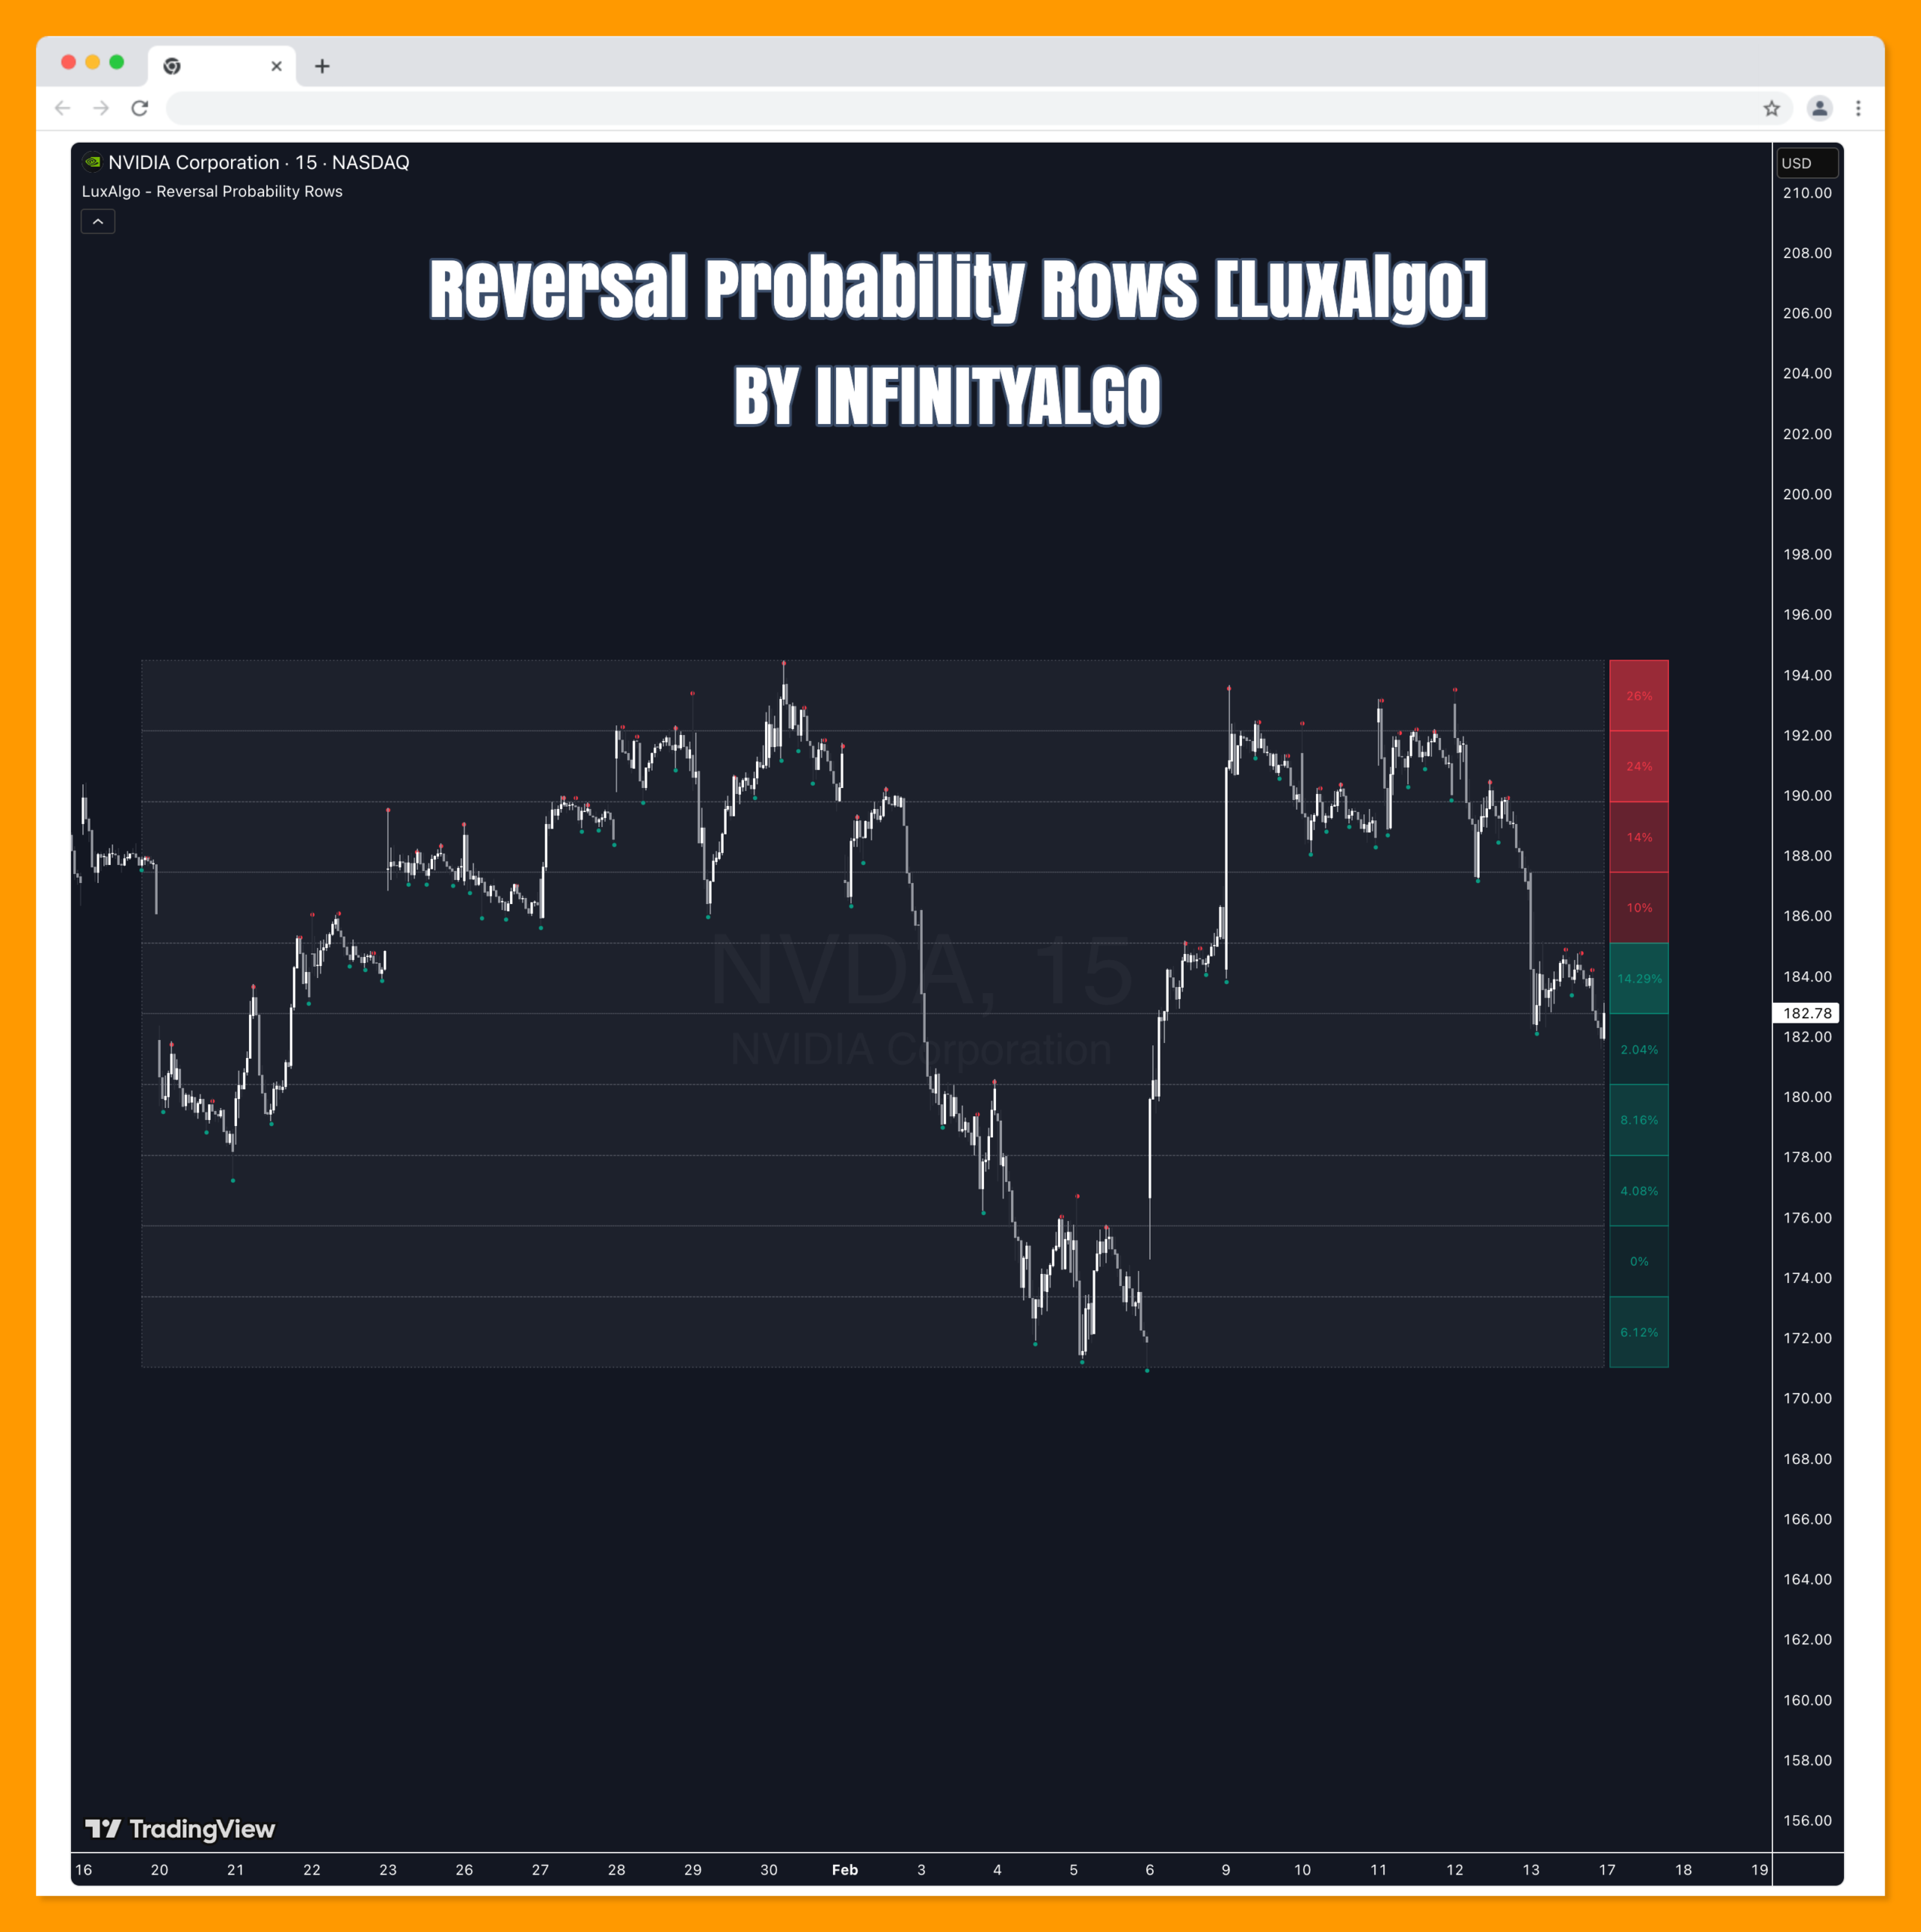
Reversal Probability Rows [LuxAlgo]
The Reversal Probability Rows tool identifies historical price zones where reversals have frequently occurred and calculates the statistical probability of a reversal happening at those levels based on the distribution of pivot points.
The Reversal Probability Rows tool identifies historical price zones where reversals have frequently occurred and calculates the statistical probability of a reversal happening at those levels based on the distribution of pivot points.
🔶 USAGE
The indicator segments the price range of a specified lookback period into several horizontal rows. Within each row, it calculates the density of historical tops (Pivot Highs) and bottoms (Pivot Lows) relative to the total number of pivots found within the entire lookback range.
Users can interpret the probability boxes to the right of the price as follows:
🔹 Bearish Reversal Zones (Red Boxes)
When the current price is below a specific row, the indicator treats that row as potential resistance. The percentage displayed represents the probability of a bearish reversal occurring there, based on how many historical tops fell within that row compared to the total number of tops in the lookback period.
🔹 Bullish Reversal Zones (Green Boxes)
When the current price is above a specific row, the indicator treats that row as potential support. The percentage represents the probability of a bullish reversal, based on how many historical bottoms fell within that row compared to the total number of bottoms in the lookback period.
🔹 Current Price Row
When the current price is moving within a specific row, the indicator identifies whether that zone has historically been more prone to tops or bottoms. It will display the dominant reversal type (the higher probability of the two) and color the box accordingly (Red for tops, Green for bottoms).
🔶 DETAILS
The script segments the “Range Period” (defined by the highest high and lowest low of the lookback) into equidistant rows. It then scans the lookback period for pivot points based on the “Pivot Sensitivity” setting.
The probability calculation follows a distribution-based approach:
Probability % = (Number of Pivots of Type X in Row / Total Number of Pivots of Type X in Lookback) * 100
The visual intensity (transparency) of the boxes is determined by the “weight” of the row; rows containing the highest frequency of pivots appear more solid, while rows with fewer historical reversals appear more transparent.
🔶 SETTINGS
🔹 Calculation Settings
- Range Period: The number of historical bars used to define the high/low range and gather statistical data.
- Number of Rows: The vertical resolution of the visualization. More rows create smaller, more specific price zones.
- Pivot Sensitivity: The number of bars required on each side of a high or low to classify it as a reversal point (Pivot).
🔹 Visualization Settings
- Show Pivot Markers: Toggles the visibility of the “•” markers on the chart that represent the historical tops and bottoms used in the calculation.
- Box Width (Bars): Adjusts the horizontal width of the probability boxes projected to the right of the current bar.
- Row Highlight Color: The background color and border style of the calculation grid area.
Related Products
100% This Pine Script™ code is subject
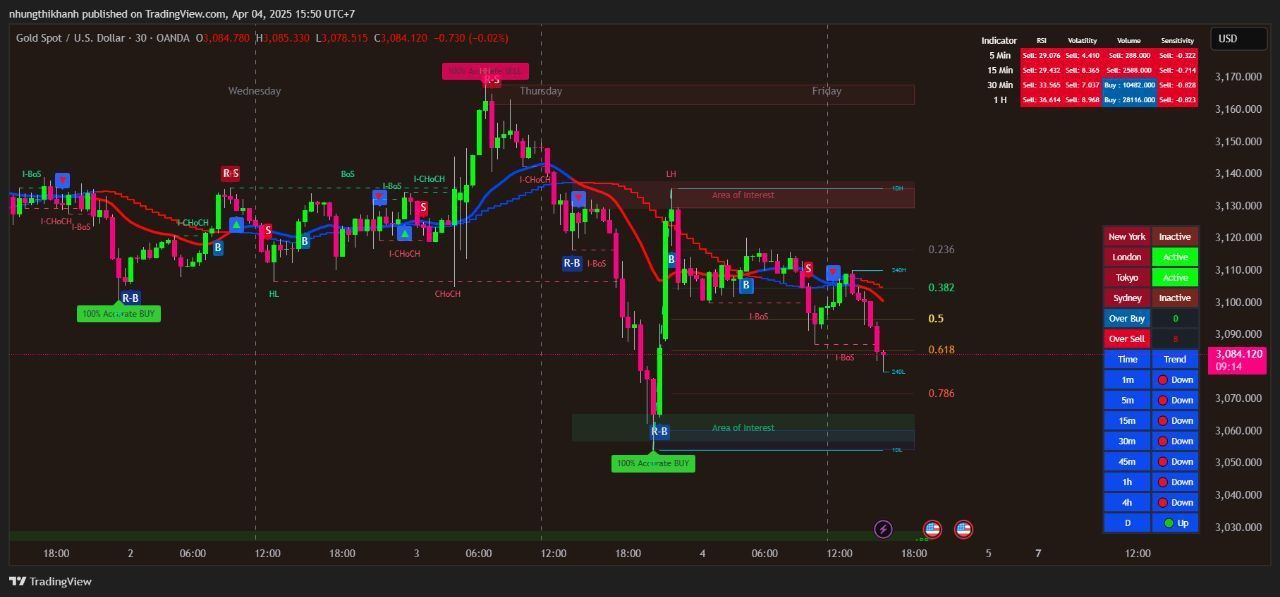
The Apex Trend & Liquidity Master is a hybrid trading system designed to align traders with the dominant market trend while identifying key structural price levels. Unlike simple moving average crossovers or standalone support/resistance tools, this script integrates a volatility-adaptive "Trend Cloud" with a "Smart Liquidity" engine.
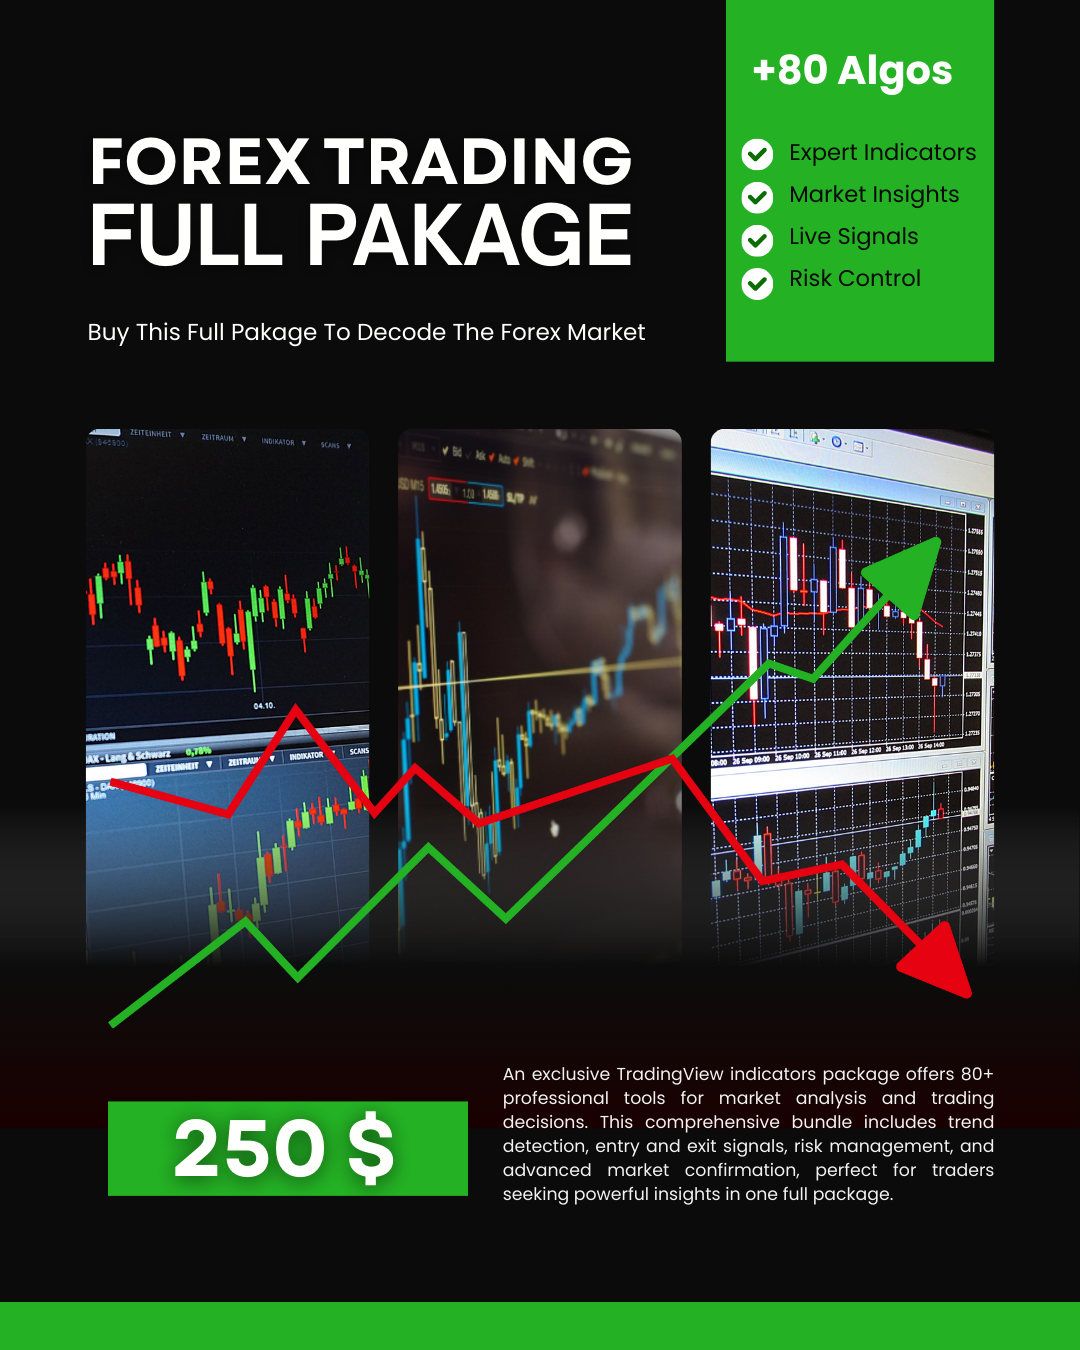
80+ Pro TradingView Indicators Bundle – Trade Smarter with One Powerful System
An exclusive TradingView indicators package featuring 80+ professional tools designed for precise market analysis and smarter trading decisions. This all-in-one bundle covers trend detection, entry and exit signals, risk management, and advanced market confirmation—ideal for traders who want powerful insights in one premium package.
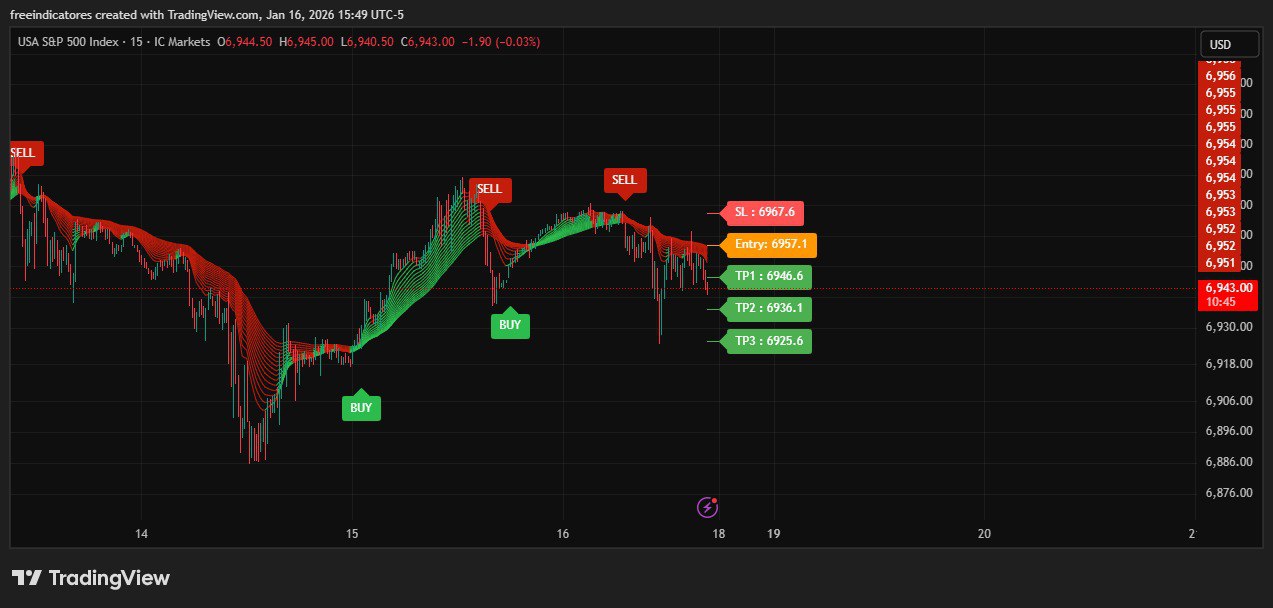
AI Signals Remastered
Signal Generation: Uses EMA clusters and a modified Supertrend (Keltner-based) to identify trends
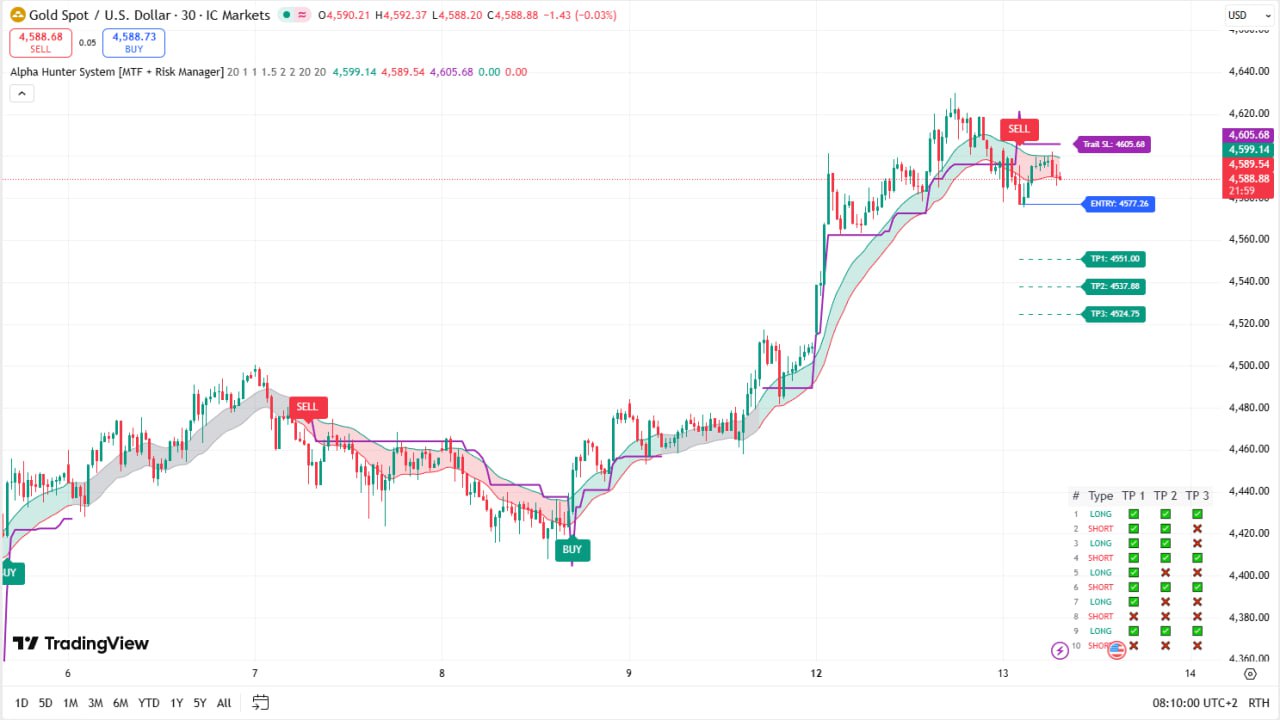
Alpha Hunter System (MTF + Risk Manager) – Full Explanation
Alpha Hunter System is a comprehensive TradingView indicator designed to combine trend detection, multi-filter confirmation, and advanced risk management into a single trading system. It is suitable for Forex, Crypto, Indices, and Stocks, and works across multiple timeframes.
![Arbitrage Detector [LuxAlgo] Download Free](https://digitaltradehub.net/wp-content/uploads/2026/01/g6Uhg3kr.png)
Arbitrage Detector [LuxAlgo] Download Free
The Arbitrage Detector unveils hidden spreads in the crypto and forex markets. It compares the same asset on the main crypto exchanges and forex brokers and displays both prices and volumes on a dashboard, as well as the maximum spread detected on a histogram divided by four user-selected percentiles.
![Arbitrage Matrix [LuxAlgo]](https://digitaltradehub.net/wp-content/uploads/2026/02/Arbitrage-Matrix-LuxAlgo.png)
Arbitrage Matrix [LuxAlgo]
The Arbitrage Matrix is a follow-up to our Arbitrage Detector that compares the spreads in price and volume between all the major crypto exchanges and forex brokers for any given asset.