
RSI Monitor (High/Low) + MTF & Time Filter
Advanced RSI monitoring tool that tracks overbought/oversold conditions using High and Low price sources across multiple timeframes, with customizable alerts and time-based filtering for precise trading signals.
RSI Monitor (High/Low) + MTF & Time Filter is a sophisticated technical analysis indicator designed for traders who need comprehensive RSI monitoring across multiple dimensions. Unlike traditional RSI indicators that use closing prices, this tool calculates RSI separately for both High and Low price sources, providing more nuanced overbought and oversold signals.
Key Features:
🔹 Dual RSI Calculation – Monitors RSI on both High and Low prices independently for more accurate extremes detection
🔹 Multi-Timeframe (MTF) Dashboard – Real-time table display showing RSI values across current chart timeframe plus two higher timeframes (default: 1H and 4H)
🔹 Smart Alert System – Configurable alerts that trigger when RSI crosses overbought (70) or oversold (30) levels on your chosen timeframe
🔹 Time-Based Filtering – Restrict alerts to specific trading sessions (e.g., 9:30 AM – 4:00 PM) to avoid off-hours noise
🔹 Visual Color Coding – Dashboard cells automatically highlight in red (overbought) or green (oversold) when thresholds are breached
🔹 Customizable Parameters – Adjust RSI length, overbought/oversold levels, timeframes, and table position to match your trading strategy
How It Works:
Buy Signals: Generated when RSI (Low source) crosses above the oversold level (default: 30)
Sell Signals: Generated when RSI (High source) crosses below the overbought level (default: 70)
Dashboard Monitor: Displays real-time RSI values for both High and Low across three timeframes simultaneously
Session Filter: Ensures alerts only fire during your specified trading hours
Ideal For:
✅ Day traders and swing traders seeking precise entry/exit points
✅ Multi-timeframe analysis enthusiasts
✅ Traders who want to filter out false signals during low-liquidity periods
✅ Those looking for more sensitive RSI readings than traditional close-based calculations
Part of the InfinityAlgo suite by InfinityAlgoLap – A professional-grade technical analysis toolset for serious traders.
Related Products

All In One Course
We are proud to announce the launch of a comprehensive, all-in-one educational program, specifically designed for anyone who wants to transition from a basic user level to a professional digital problem-solver and solution builder.
![Breakout Targets [InfinityAlgo]](https://digitaltradehub.net/wp-content/uploads/2026/02/Breakout-Targets-InfinityAlgo-scaled.png)
Breakout Targets [InfinityAlgo]
This script identifies consolidation zones and provides automated breakout targets with risk management levels. It focuses on finding periods where price action compresses and then tracks the subsequent breakout from these ranges
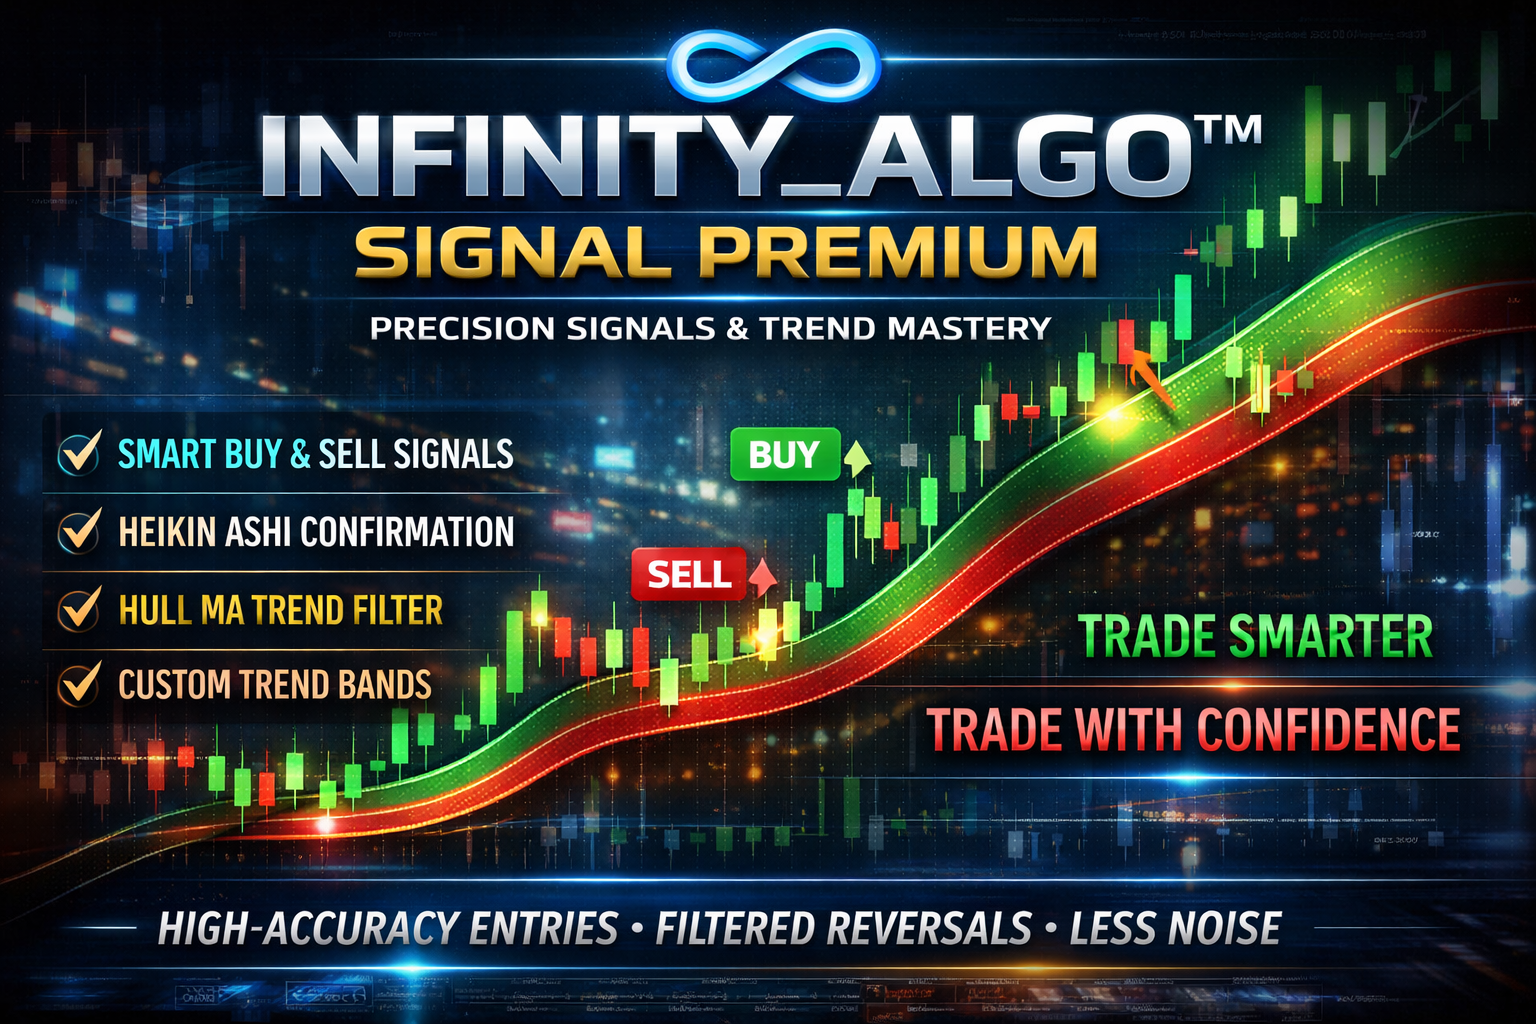
Infinity_Algo™ Signal Premium — Precision Signals & Trend Mastery
Infinity_Algo™ Signal Premium isn’t just another signal indicator — it’s a smart entry engine with institutional-grade filtering and high-confidence trade cues.
InfinityRSI-Divergence-V.6.2
InfinityRSI-Divergence-V.6.2 is an advanced technical trading indicator designed to automatically detect regular and hidden RSI divergences between price action and the Relative Strength Index. It helps traders anticipate potential trend reversals and continuation opportunities with greater accuracy.
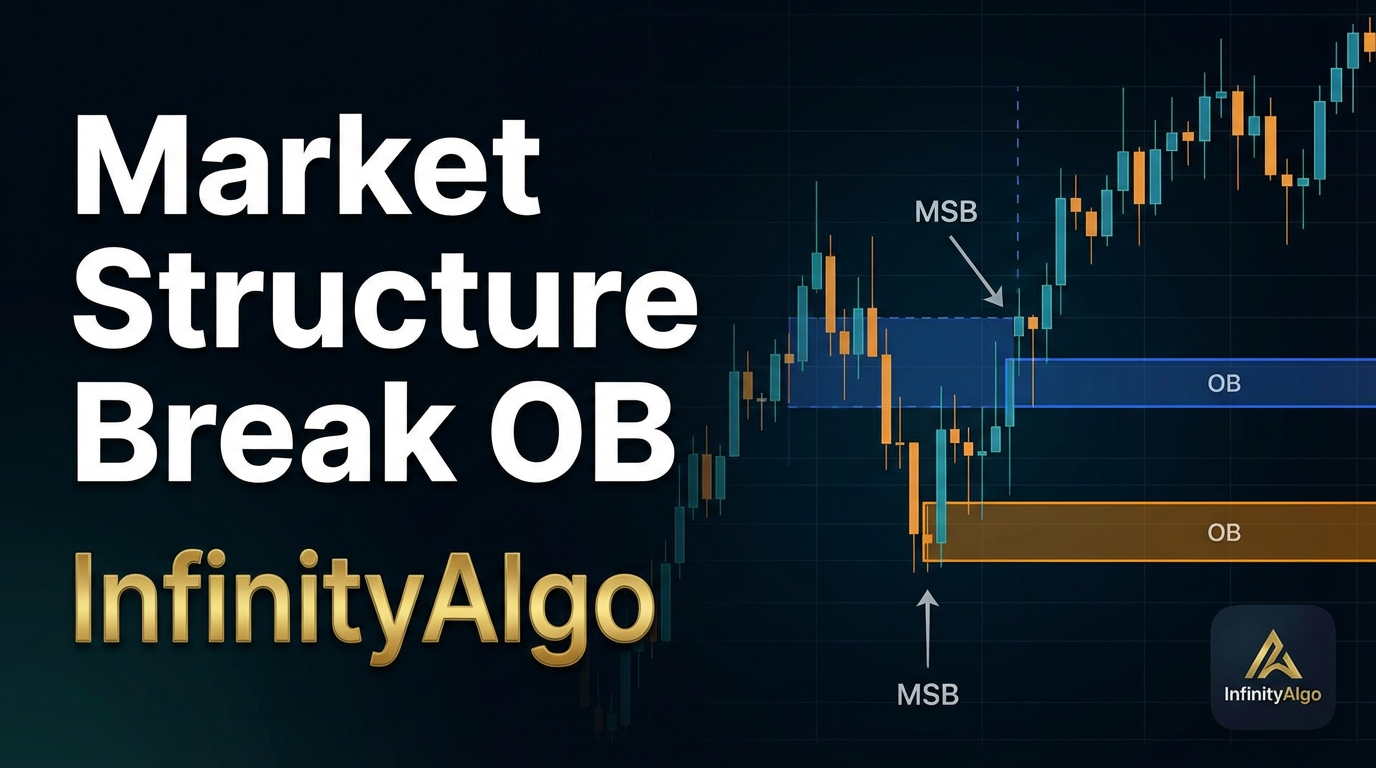
Market Structure Break & Order Block By InfinityAlgo
This tool is an advanced analytical framework for traders who use institutional trading concepts, often referred to as Smart Money Concepts (SMC). It is designed to identify significant shifts in market structure and high-probability trading zones based on institutional activity.

Membership System – InfinityAlgo
A smart and seamless space designed to manage memberships efficiently, offering advanced tools for organizing members, controlling access, and enhancing the overall user experience within the InfinityAlgo ecosystem.