
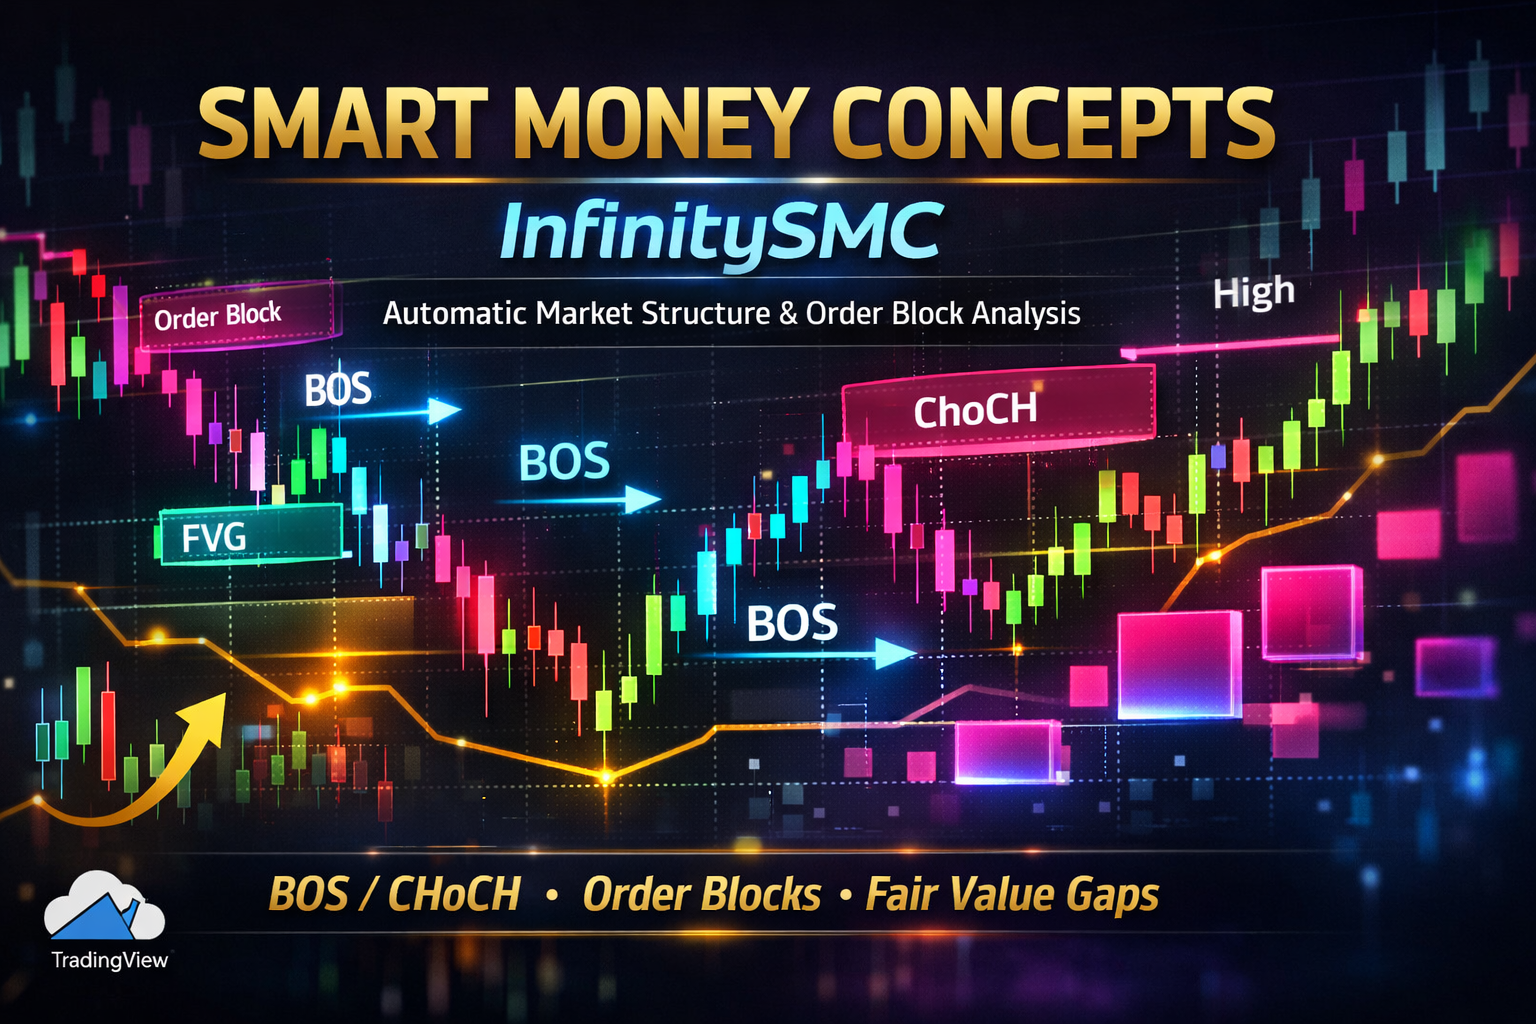
Smart Money Concepts (InfinitySMC) – Full Strategy Explanation
Strategy Philosophy (Core Idea) The Smart Money Concepts (SMC) strategy is based on tracking the behavior of institutional traders (“smart money”) rather than retail indicators.
Smart Money Concepts (InfinitySMC) – Full Strategy Explanation
1. Strategy Philosophy (Core Idea)
The Smart Money Concepts (SMC) strategy is based on tracking the behavior of institutional traders (“smart money”) rather than retail indicators.
The logic assumes that:
-
Markets move in structures (highs & lows)
-
Institutions leave footprints such as:
-
Breaks of Structure (BOS)
-
Change of Character (CHoCH)
-
Order Blocks (OB)
-
Fair Value Gaps (FVG)
-
Equal Highs & Equal Lows (liquidity pools)
-
This indicator does not predict the market.
It maps market structure and liquidity, allowing the trader to:
-
Identify trend direction
-
Spot institutional entry zones
-
Trade in alignment with smart money
2. Market Structure Logic
2.1 Swing Structure vs Internal Structure
The indicator tracks two types of structure:
| Type | Meaning | Usage |
|---|---|---|
| Swing Structure | Higher timeframe structure | Trend direction |
| Internal Structure | Lower timeframe structure | Precise entries |
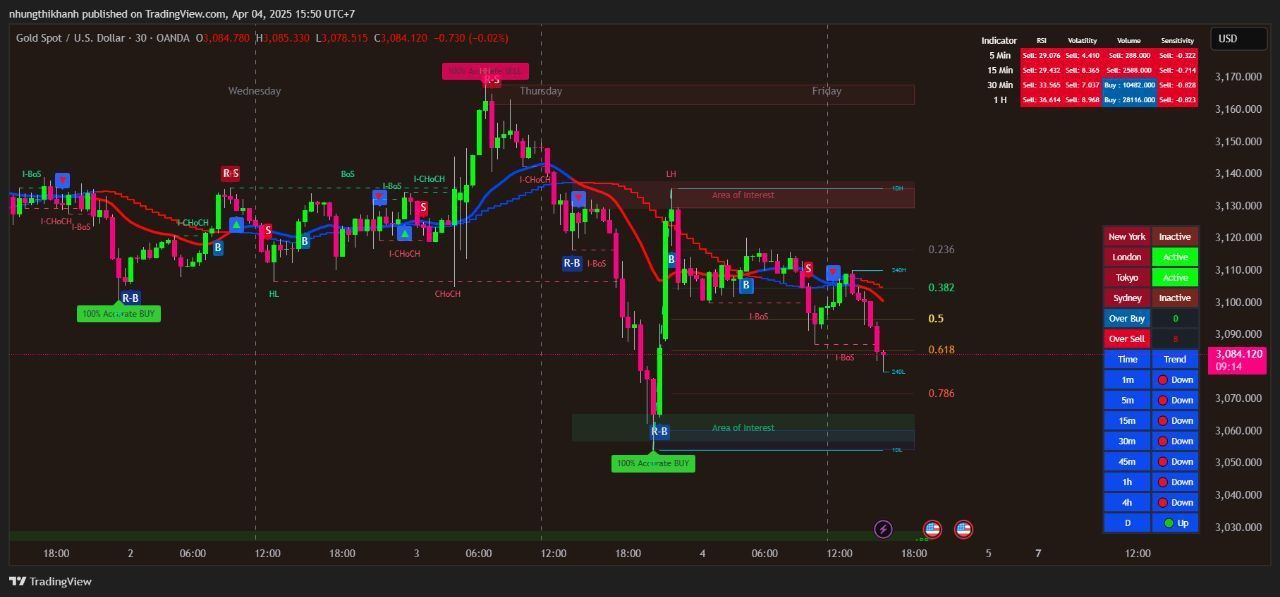
2.2 Break of Structure (BOS)
BOS happens when price breaks the previous high or low in the direction of the trend.
-
Bullish BOS → continuation of uptrend
-
Bearish BOS → continuation of downtrend
Trading Meaning:
The trend is confirmed and institutions are still in control.
2.3 Change of Character (CHoCH)
CHoCH occurs when price breaks structure in the opposite direction of the current trend.
-
Bullish CHoCH → bearish → bullish shift
-
Bearish CHoCH → bullish → bearish shift
Trading Meaning:
Possible trend reversal or major pullback.
CHoCH is one of the most important SMC signals.
3. Swing Highs & Lows (Market Geometry)
The indicator identifies:
-
HH – Higher High
-
HL – Higher Low
-
LH – Lower High
-
LL – Lower Low
It also classifies:
-
Strong High / Strong Low
-
Weak High / Weak Low
Strong vs Weak Levels
-
Strong High → unlikely to be taken soon
-
Weak High → likely liquidity target
-
Weak Low → liquidity resting below
-
Strong Low → defended by institutions
Trading Meaning:
Liquidity is hunted before real moves start.
4. Order Blocks (Institutional Zones)
4.1 What is an Order Block?
An Order Block (OB) is the last opposite candle before a strong impulsive move.
It represents:
-
Institutional buying or selling
-
Areas where price is likely to react again
4.2 Internal vs Swing Order Blocks
| Type | Timeframe | Purpose |
|---|---|---|
| Internal OB | Lower TF | Entries & scalping |
| Swing OB | Higher TF | Major zones & bias |
4.3 Order Block Validation
Order Blocks are:
-
Filtered using ATR or Cumulative Mean Range
-
Removed once price fully breaks them
Trading Rule:
Trade reactions, not breakouts, from valid OBs.
5. Equal Highs & Equal Lows (Liquidity)
Equal Highs (EQH)
-
Two or more highs at similar price
-
Above them lies buy-side liquidity
Equal Lows (EQL)
-
Two or more lows at similar price
-
Below them lies sell-side liquidity
Trading Meaning:
Price often sweeps liquidity before reversing.
Used for:
-
Stop hunts
-
Fake breakouts
-
Entry confirmation
6. Fair Value Gaps (FVG)
What is a Fair Value Gap?
A Fair Value Gap occurs when price moves so fast that:
-
A candle leaves an imbalance
-
One side of the market was inefficiently filled
Types:
-
Bullish FVG → expect retracement down
-
Bearish FVG → expect retracement up
Trading Rule:
Price tends to revisit FVGs before continuation.
7. Premium, Discount & Equilibrium Zones
Based on the most recent swing high and low:
| Zone | Meaning |
|---|---|
| Premium | Expensive price (sell zone) |
| Discount | Cheap price (buy zone) |
| Equilibrium | 50% range |
Golden Rule:
-
Buy only in discount
-
Sell only in premium
8. Multi-Timeframe Highs & Lows
The indicator can display:
-
Previous Daily High / Low
-
Previous Weekly High / Low
-
Previous Monthly High / Low
These act as:
-
Liquidity magnets
-
Take-profit targets
-
Reversal zones
9. Trend Detection & Candle Coloring
Trend is determined by internal structure (itrend):
-
Green candles → bullish structure
-
Red candles → bearish structure
This avoids lagging indicators like moving averages.
10. Alerts System
The indicator provides alerts for:
-
BOS / CHoCH (internal & swing)
-
Order Block breakouts
-
Equal Highs / Lows
-
Fair Value Gaps
This allows hands-free monitoring.
11. How Traders Use InfinitySMC (Practical Workflow)
Step-by-Step Trading Model
-
Identify trend using swing structure
-
Wait for CHoCH (possible reversal)
-
Confirm BOS in new direction
-
Mark Order Block in discount / premium
-
Align with FVG or liquidity sweep
-
Enter on lower timeframe
-
Target liquidity (EQH/EQL, PDH/PDL)
12. What This Strategy Is NOT
-
❌ Not a signal indicator
-
❌ Not a scalping robot
-
❌ Not predictive
It is a market framework, not a shortcut.
Final Summary
InfinitySMC is a complete Smart Money framework that:
-
Maps institutional structure
-
Identifies liquidity
-
Highlights high-probability zones
-
Works on any market & timeframe
When used correctly, it allows traders to:
“Stop chasing price and start waiting for price to come to them.”
Related Products
100% This Pine Script™ code is subject
The Apex Trend & Liquidity Master is a hybrid trading system designed to align traders with the dominant market trend while identifying key structural price levels. Unlike simple moving average crossovers or standalone support/resistance tools, this script integrates a volatility-adaptive "Trend Cloud" with a "Smart Liquidity" engine.
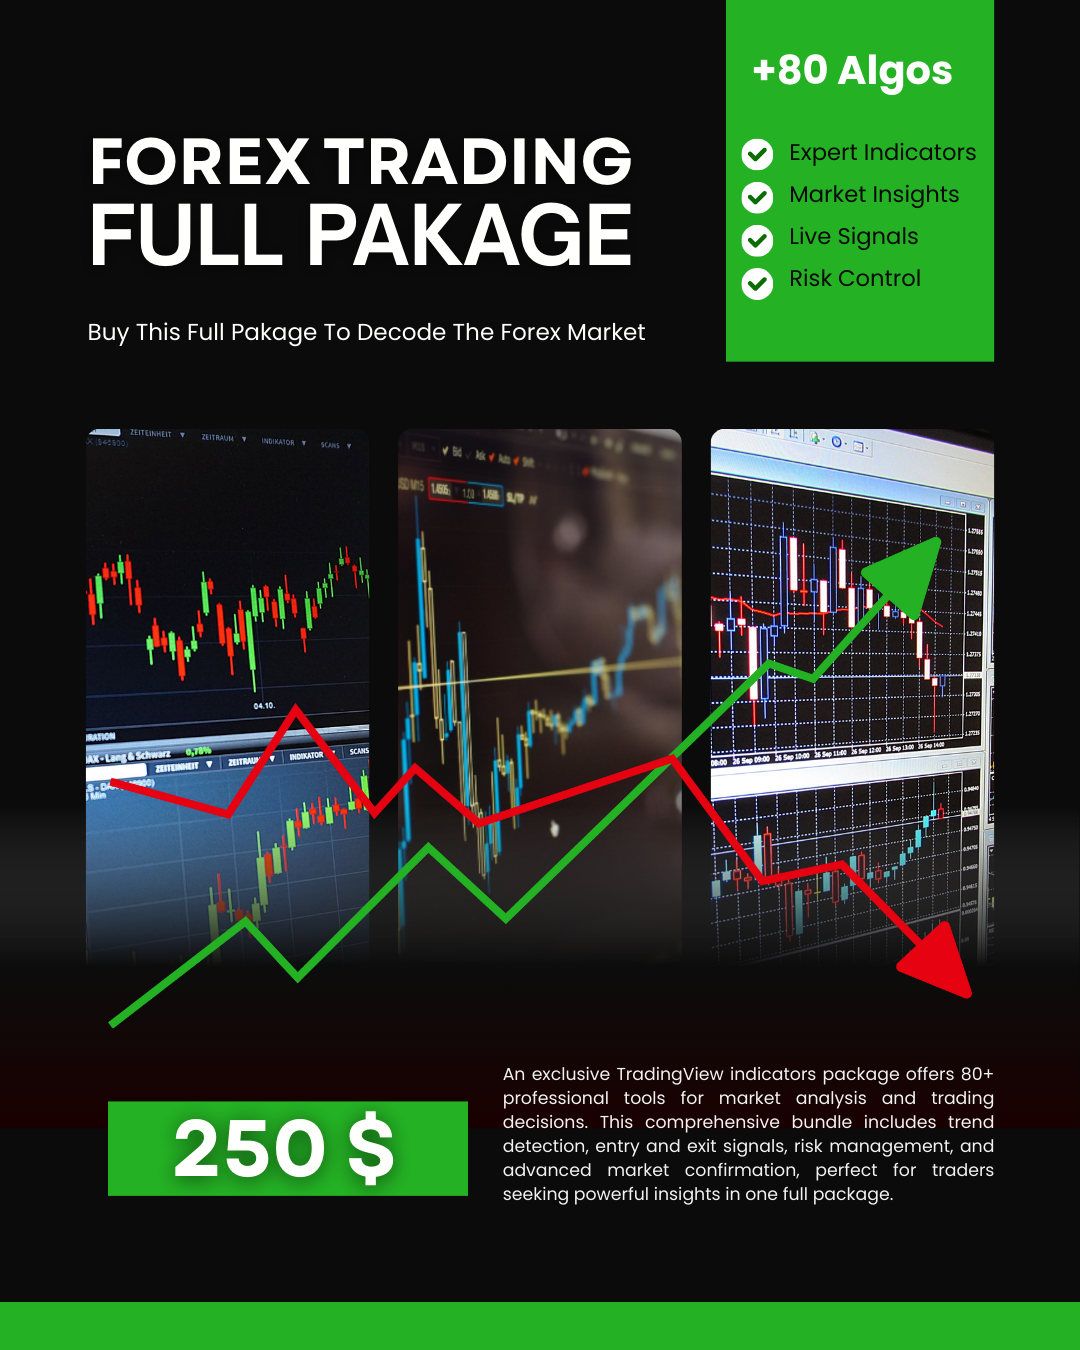
80+ Pro TradingView Indicators Bundle – Trade Smarter with One Powerful System
An exclusive TradingView indicators package featuring 80+ professional tools designed for precise market analysis and smarter trading decisions. This all-in-one bundle covers trend detection, entry and exit signals, risk management, and advanced market confirmation—ideal for traders who want powerful insights in one premium package.
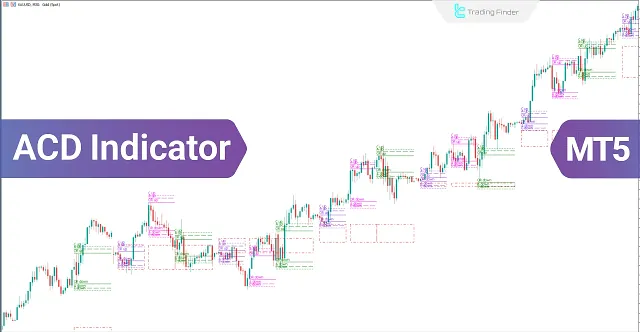
ACD Indicator for MetaTrader 5 Download - Free
The ACD indicator is a technical analysis tool in MetaTrader 5 developed by Mark Fisher and can also be used as a trading strategy. This tool is highly suitable for detecting daily price trends.
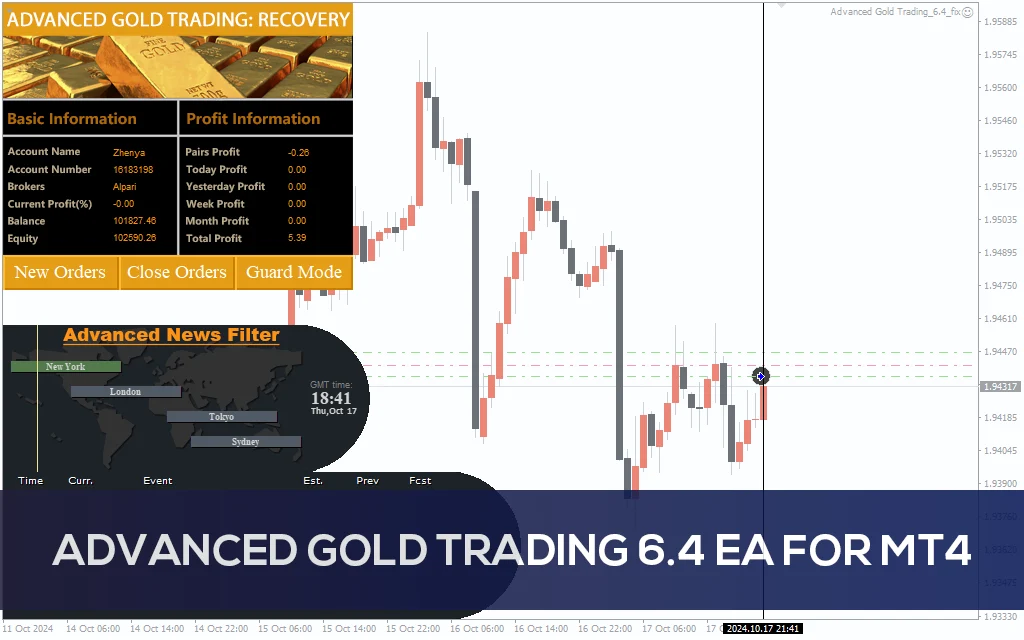
Advanced Gold Trading V6.4 EA MT4
Advanced Gold Trading V6.4 EA MT4 CATEGORY: MT4 EXPERTS
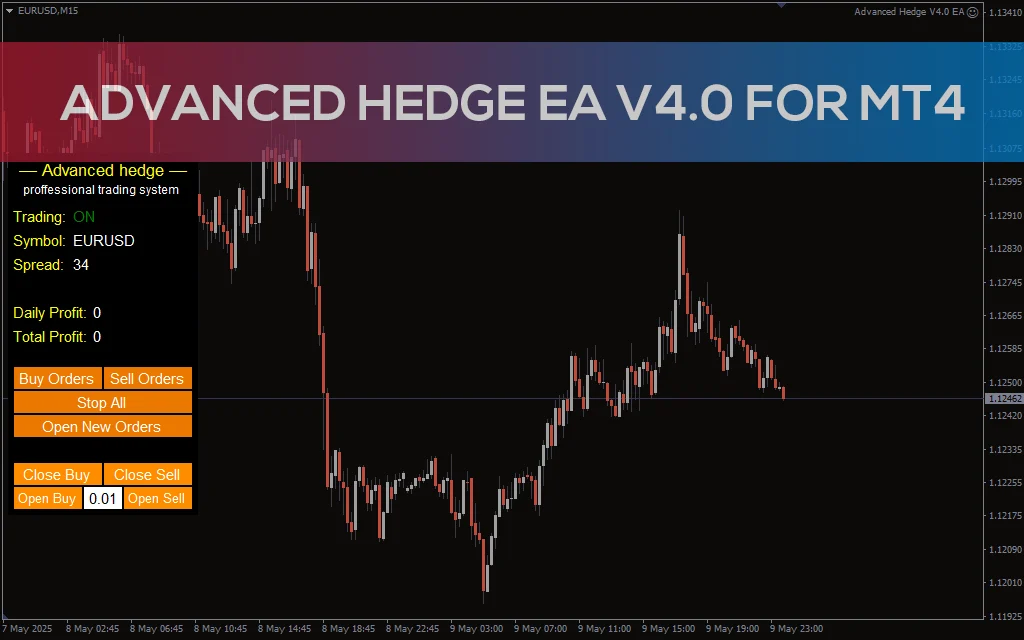
Advanced Hedge EA V4.0 MT4
Discover the Advanced Hedge EA V4.0 for MT4. This powerful automated trading tool helps users manage multiple hedged positions while optimizing profits and minimizing risks. Perfect for Forex traders who seek a reliable and sophisticated hedging strategy. CATEGORY: MT4 EXPERTS
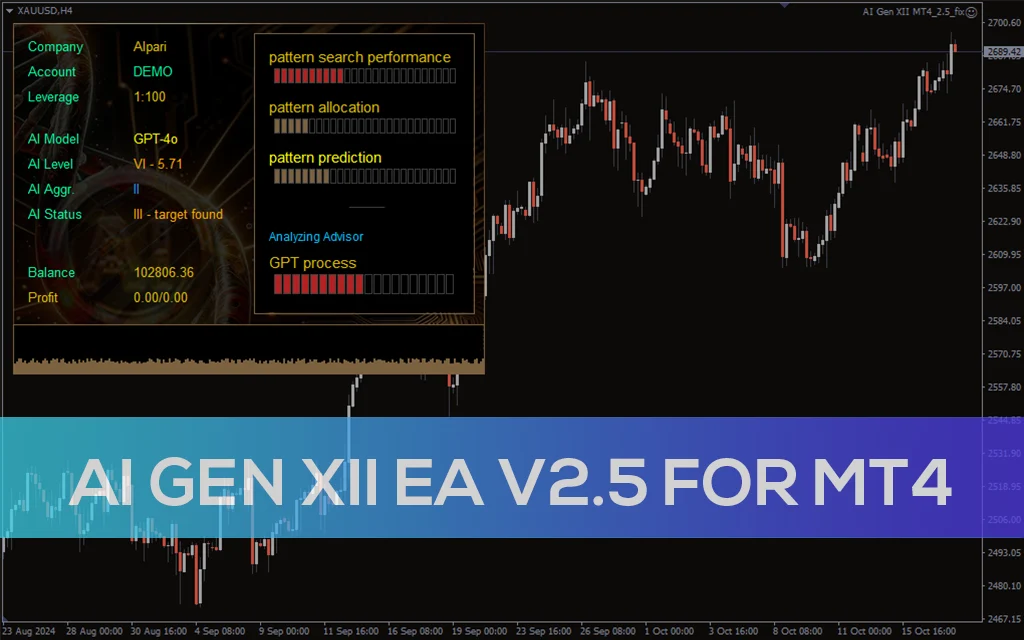
AI Gen XII EA V2.5 MT4
A sophisticated AI-driven AI Gen XII EA V2.5 that leverages machine learning for pattern prediction and high-frequency trading on MT4.