
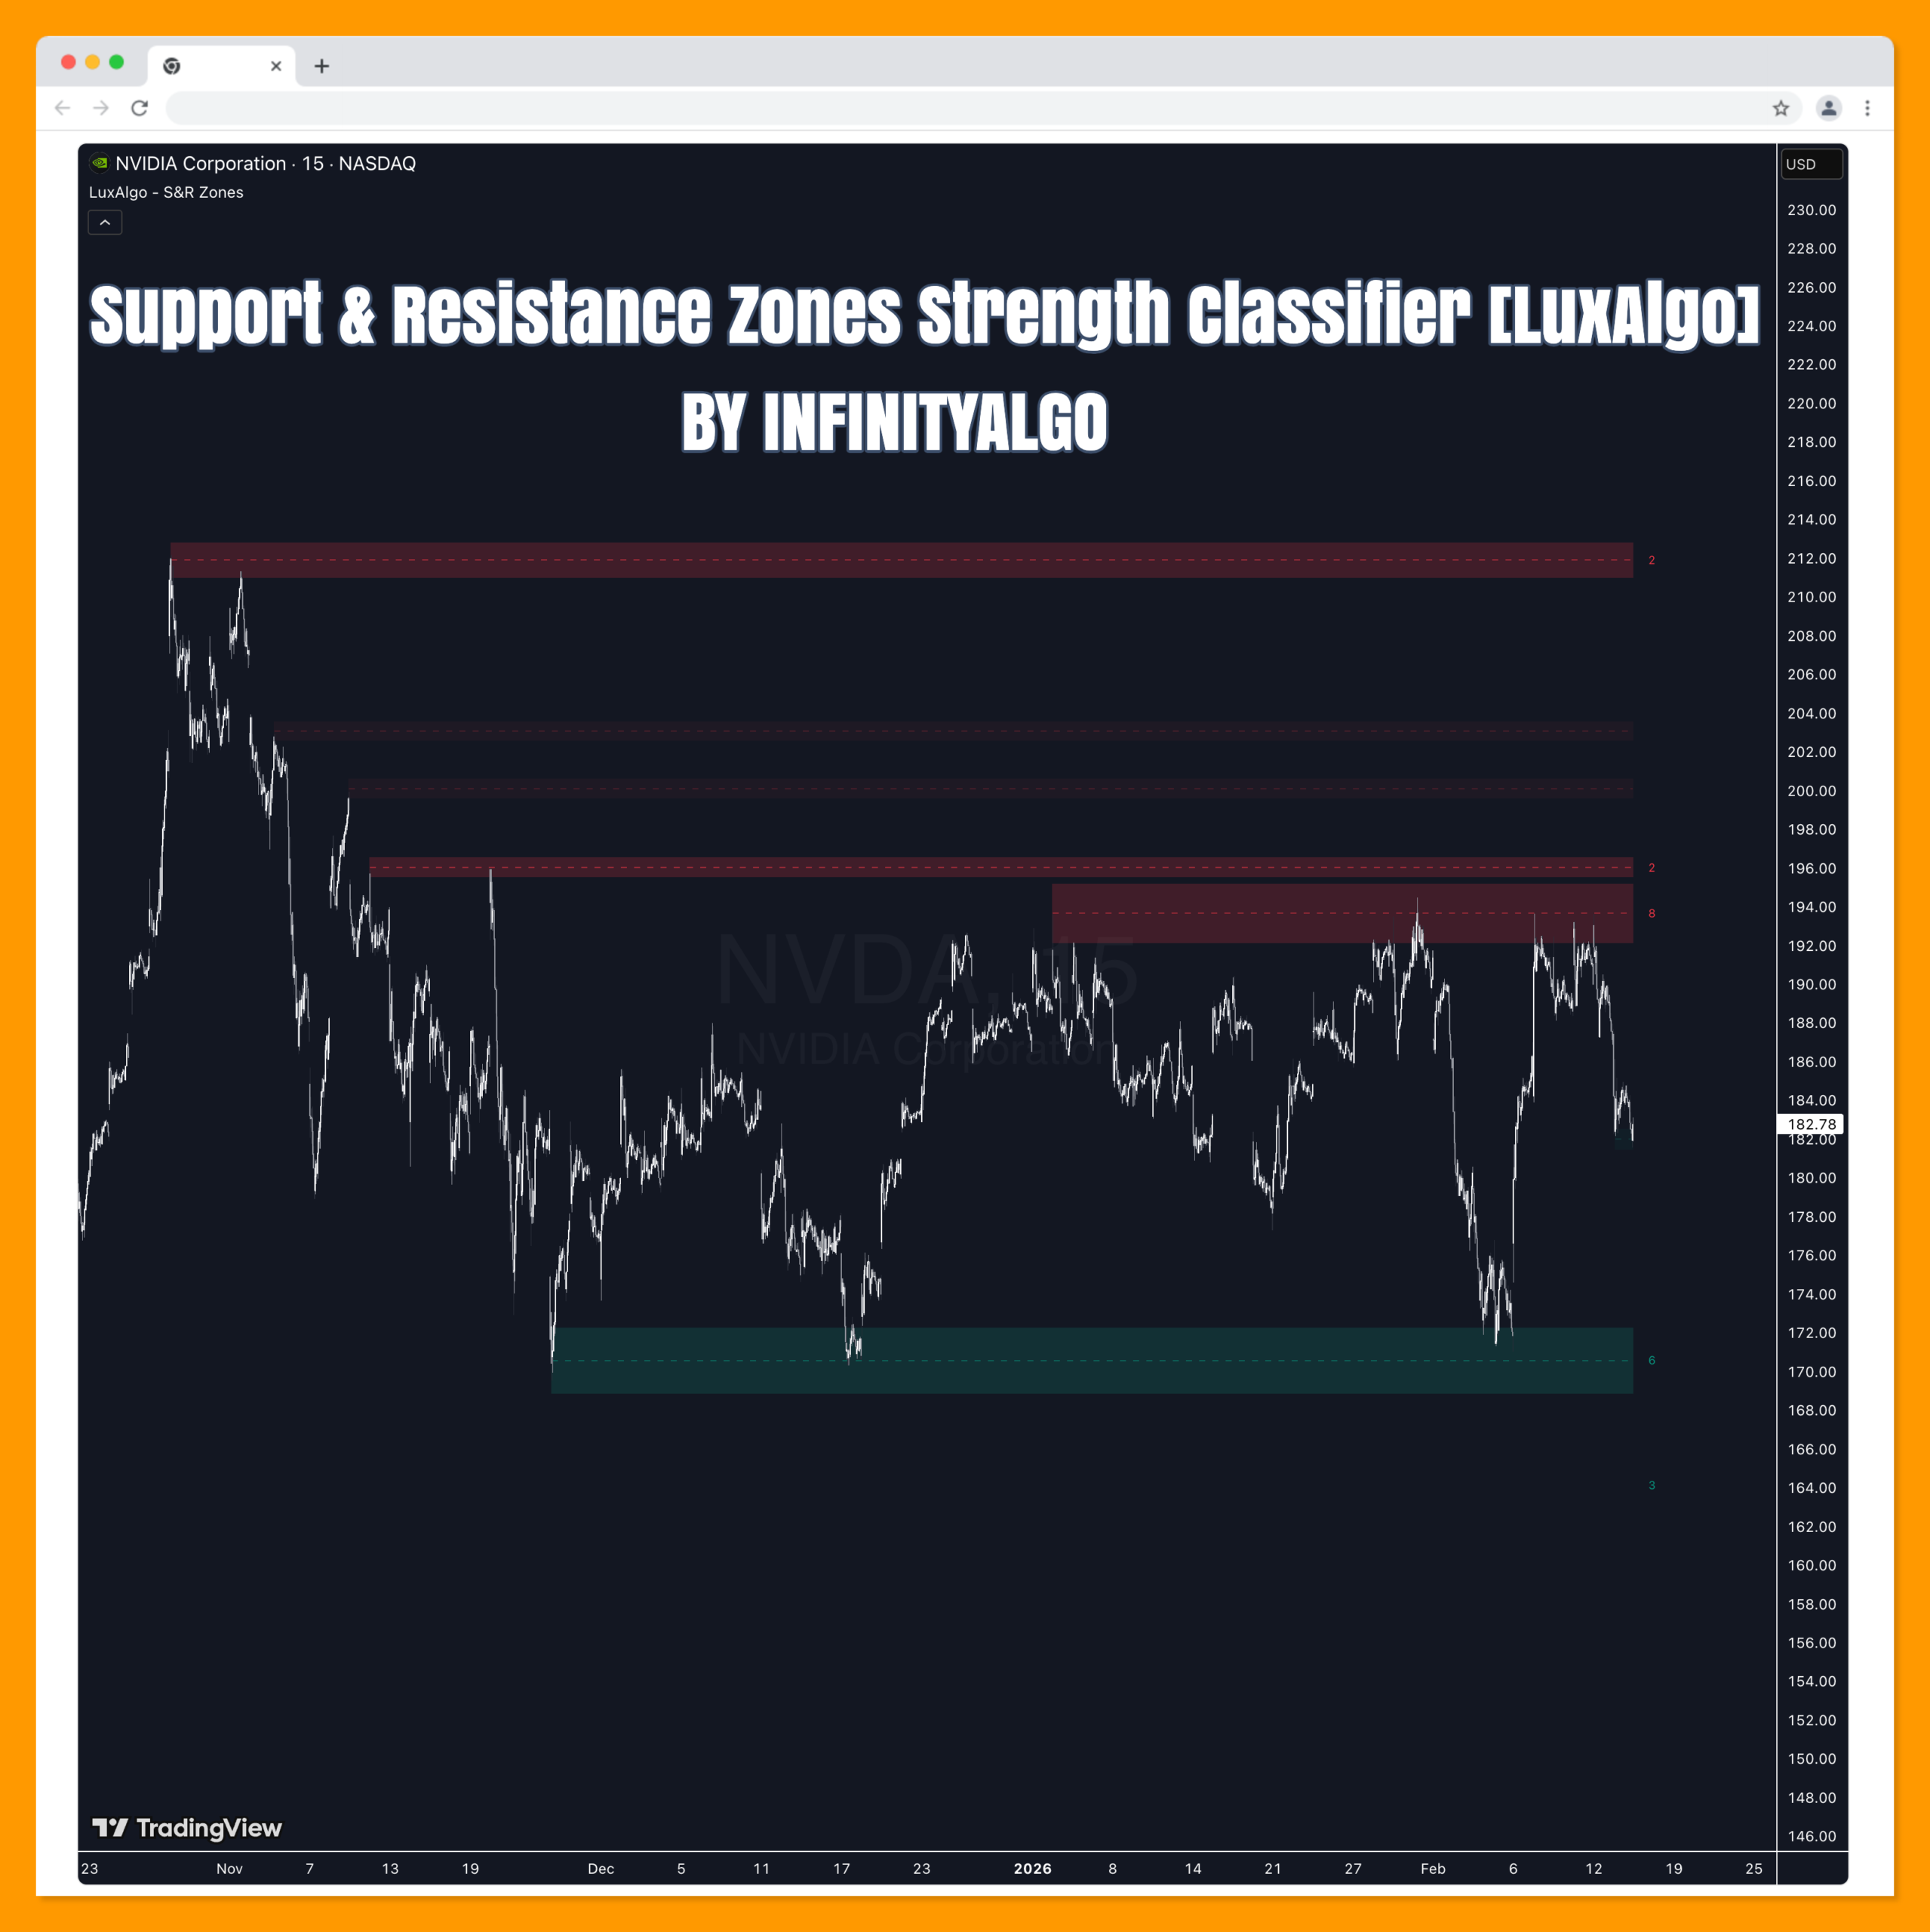
Support & Resistance Zones Strength Classifier [LuxAlgo]
The Support & Resistance Zones Strength Classifier indicator is a technical tool designed to identify and visualize key market levels by grouping pivot points into dynamic zones that adapt to price action. It emphasizes zone "strength" by tracking the number of times level is tested and automatically removes zones that have been breached by price
The Support & Resistance Zones Strength Classifier indicator is a technical tool designed to identify and visualize key market levels by grouping pivot points into dynamic zones that adapt to price action. It emphasizes zone “strength” by tracking the number of times a level is tested and automatically removes zones that have been breached by price.
🔶 USAGE
This indicator identifies potential areas of supply and demand based on historical pivot highs and lows. Instead of displaying a single line for every pivot, it consolidates nearby price points into cohesive zones, making it easier to visualize significant levels of interest.
🔹 Strength Classification
Zones are visually classified based on their “test count.” A zone is created when a pivot is detected, and its count increases every time price returns to that area without breaking through it.
- Weak/New Zones: Displayed with higher transparency to indicate they have not yet been established as significant.
- Strong/Tested Zones: Displayed with higher opacity and a clear test count label (if enabled) to highlight levels where the market has historically reacted multiple times.
🔹 Dynamic Zone Management
The tool actively manages the chart real-estate by:
- Merging: If two zones overlap, they are merged into a single, wider zone, and their test counts are combined.
- Breakout Deletion: If a candle close penetrates the boundary of a support (below) or resistance (above) zone, that zone is considered “broken” and is immediately removed from the chart.
-
- Resistance zones turn into potential support once broken (though this specific script focuses on current active boundaries).
- Support zones act as floors until a close below occurs.
🔶 DETAILS
The script calculates zone thickness using a volatility-adjusted distance (average bar range). This ensures that zones on a high-volatility asset like Bitcoin are proportionally thicker than zones on a low-volatility asset like a stablecoin or a blue-chip stock.
The “Pivot Lookback” setting determines the sensitivity of the detection. A higher lookback will identify major swing points but may ignore intraday fluctuations, while a lower lookback will create more frequent, smaller zones.
🔶 SETTINGS
🔹 Calculation
- Pivot Lookback: The number of bars required on each side of a high or low to confirm a pivot point.
- Zone Width (dist Multiplier): Multiplier applied to the average bar range to determine the vertical thickness of new zones.
- Minimum Tests to Highlight: The number of touches required before a zone is drawn with higher visibility/opacity.
- Max Active Zones Per Type: Limits the total number of support and resistance zones maintained on the chart to prevent clutter.
- Max Zone Height (dist Multiplier): A safety threshold that deletes zones if they become too wide due to excessive merging.
🔹 Visuals
- Support/Resistance Colors: Customizable colors for the bullish (support) and bearish (resistance) areas.
- Show Test Count Labels: Toggles the visibility of the numerical label showing how many times a zone was tested.
- Extend Zones to Right: Continues the zone boxes to the most recent bar on the chart.
Related Products
100% This Pine Script™ code is subject
The Apex Trend & Liquidity Master is a hybrid trading system designed to align traders with the dominant market trend while identifying key structural price levels. Unlike simple moving average crossovers or standalone support/resistance tools, this script integrates a volatility-adaptive "Trend Cloud" with a "Smart Liquidity" engine.
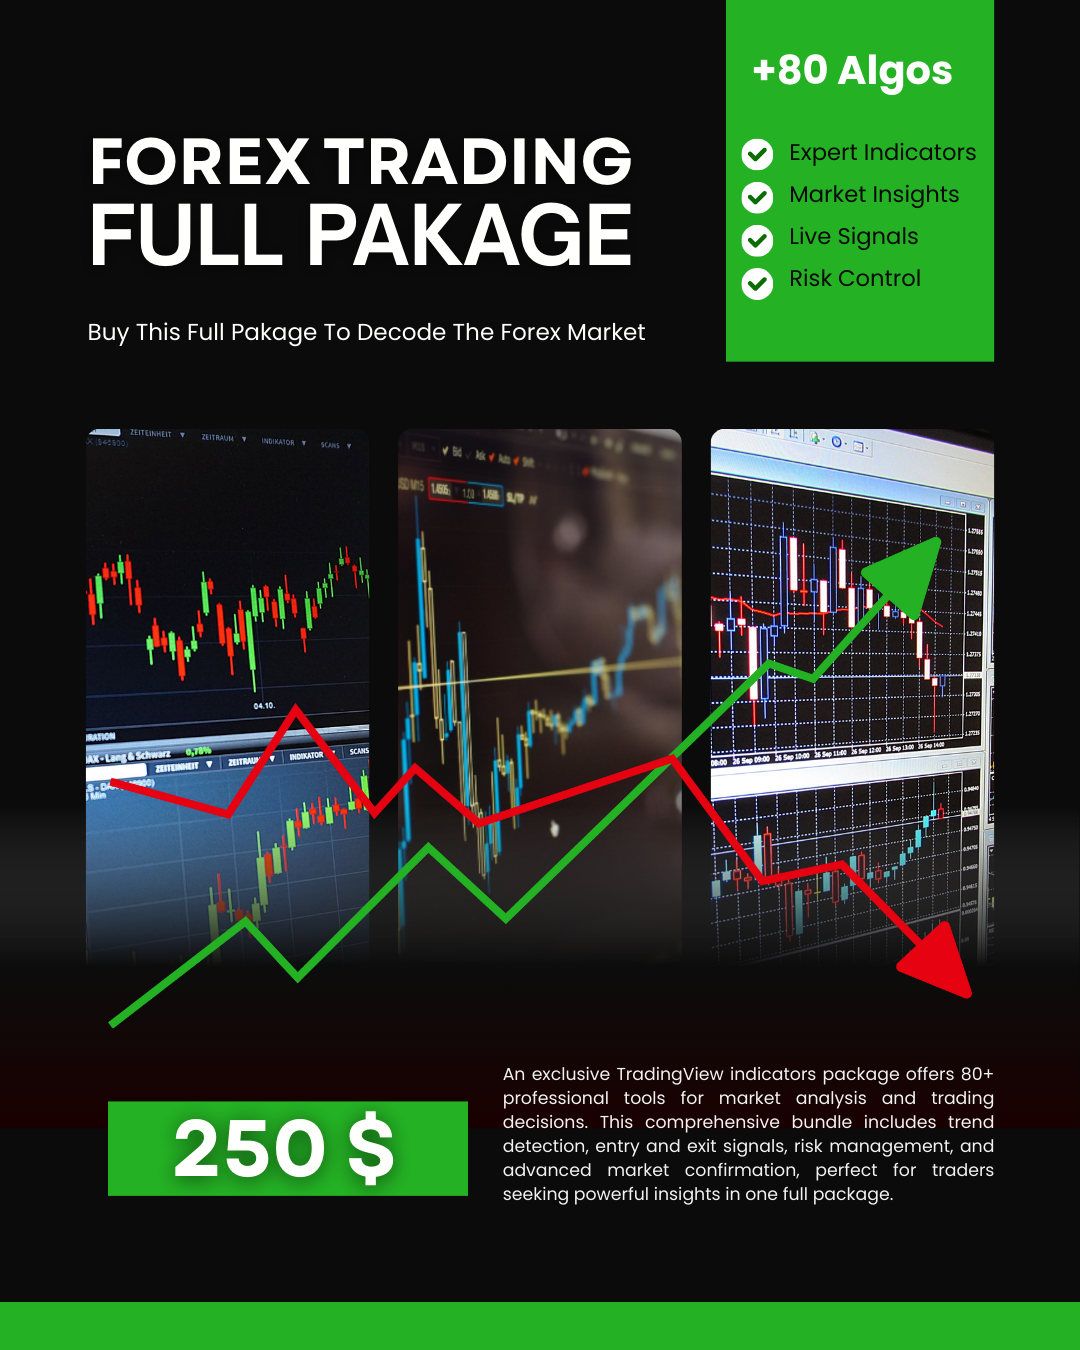
80+ Pro TradingView Indicators Bundle – Trade Smarter with One Powerful System
An exclusive TradingView indicators package featuring 80+ professional tools designed for precise market analysis and smarter trading decisions. This all-in-one bundle covers trend detection, entry and exit signals, risk management, and advanced market confirmation—ideal for traders who want powerful insights in one premium package.
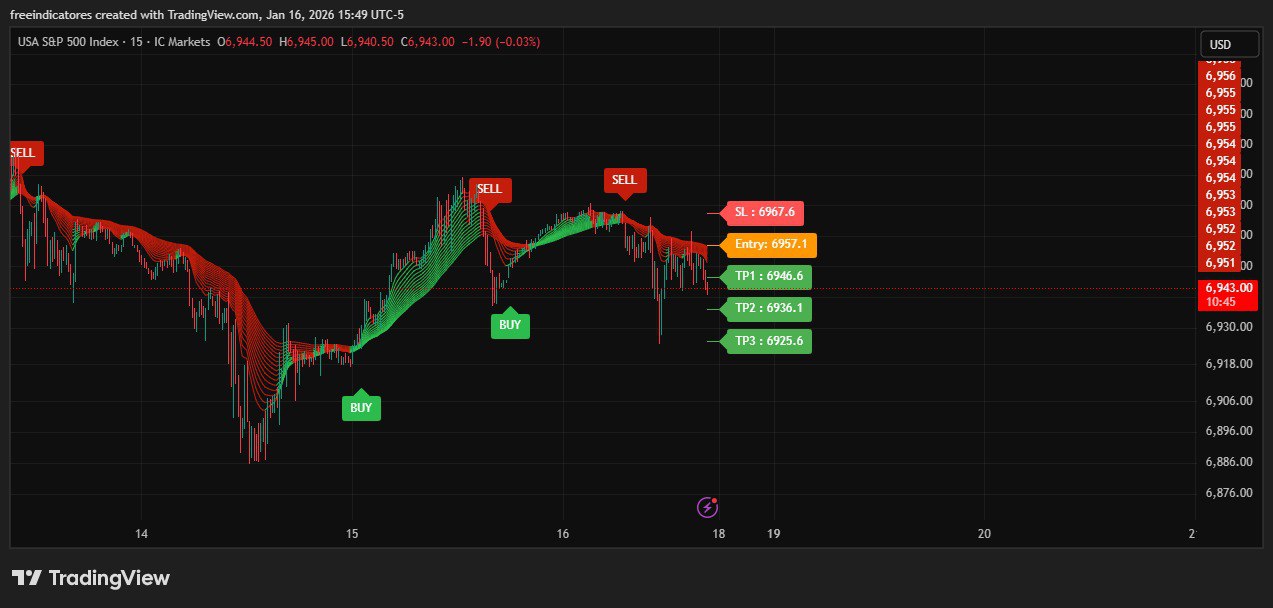
AI Signals Remastered
Signal Generation: Uses EMA clusters and a modified Supertrend (Keltner-based) to identify trends
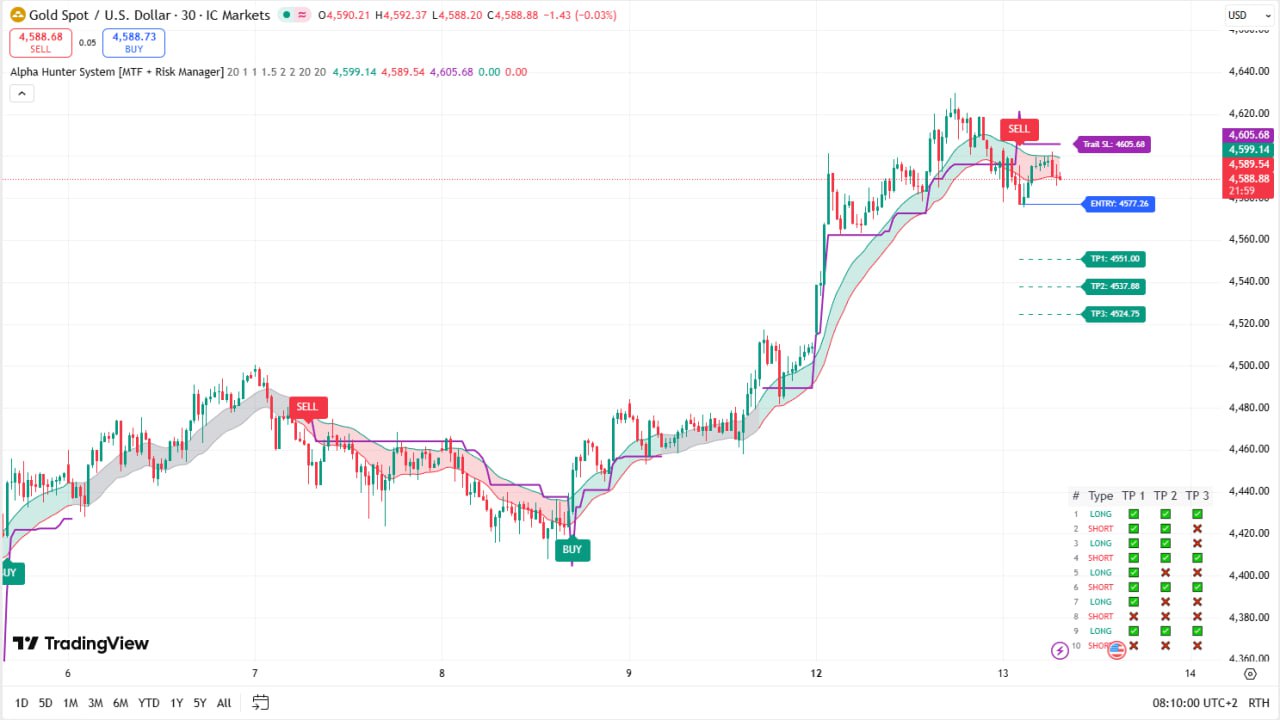
Alpha Hunter System (MTF + Risk Manager) – Full Explanation
Alpha Hunter System is a comprehensive TradingView indicator designed to combine trend detection, multi-filter confirmation, and advanced risk management into a single trading system. It is suitable for Forex, Crypto, Indices, and Stocks, and works across multiple timeframes.
![Arbitrage Detector [LuxAlgo] Download Free](https://digitaltradehub.net/wp-content/uploads/2026/01/g6Uhg3kr.png)
Arbitrage Detector [LuxAlgo] Download Free
The Arbitrage Detector unveils hidden spreads in the crypto and forex markets. It compares the same asset on the main crypto exchanges and forex brokers and displays both prices and volumes on a dashboard, as well as the maximum spread detected on a histogram divided by four user-selected percentiles.
![Arbitrage Matrix [LuxAlgo]](https://digitaltradehub.net/wp-content/uploads/2026/02/Arbitrage-Matrix-LuxAlgo.png)
Arbitrage Matrix [LuxAlgo]
The Arbitrage Matrix is a follow-up to our Arbitrage Detector that compares the spreads in price and volume between all the major crypto exchanges and forex brokers for any given asset.